
The Forex Factory economic calendar is a free, real-time schedule of global economic events that forex traders use to anticipate market volatility and plan trades. It covers critical releases like the Non-Farm Payrolls (NFP), Consumer Price Index (CPI), and central bank interest rate decisions. The calendar color-codes each event by impact level, red for high, orange for medium, and yellow for low, so you know exactly where to focus your attention. For any trader serious about risk management and trade timing, this tool belongs open in your browser every single session.
How does the forex factory economic calendar work?
The calendar lists every scheduled economic release in chronological order. Each row shows the event time, the affected currency, the impact color code, and three data columns: previous, forecast, and actual. Those three numbers tell the real story.
Understanding the three data columns:
- Previous: The last reported figure for that indicator. This is your baseline.
- Forecast: The market consensus estimate. Institutions and analysts price this in before the release.
- Actual: The number released in real time. The gap between actual and forecast drives the price move.
Market reaction often depends on how much of the economic news was already priced in by institutions. Better-than-expected news does not always push prices higher if the market already expected a strong number. That is the single most misunderstood concept among newer traders using any forex schedule of events.
The calendar’s time zone adjustment feature is one of its most practical tools. Set it to your local time zone once, and every event aligns with your trading session automatically. Filtering by currency pair and impact level removes the noise. If you only trade EUR/USD, there is no reason to track every AUD or CAD release cluttering your view.

Pro Tip: Click the event title on any Forex Factory listing to open the Detail and Graph views. These show months of actual versus forecast trends, giving you far more predictive context than a single data point ever could.
The Detail and Graph options provide more predictive power than any single release. Viewing a six-month trend of CPI misses versus beats tells you whether the economy is consistently surprising to the upside or downside. That context shapes how aggressively the market will react to the next print.
Best practices for using the economic calendar in trading
Using the calendar well is a discipline, not just a habit. Most traders open it, see a red event, and either freeze or rush into a trade. Both reactions cost money.
-
Treat red events as risk management checkpoints, not entry signals. Liquidity thins and spreads widen during high-impact releases. That means your stop loss can get hit at a price far worse than expected. Unless you specialize in volatility trading, close or reduce positions before major red events.
-
Watch for data revisions. Economic data revisions often cause more lasting market moves than the headline release itself. A strong NFP number paired with a downward revision to the prior month tells a very different story than the headline suggests. Traders who miss revisions misread the move.
-
Filter ruthlessly. Filtering by currency and impact reduces noise and keeps you focused. If you trade GBP/JPY, you track GBP and JPY events only. Everything else is a distraction that invites overtrading.
-
Combine calendar data with your chart analysis. The calendar tells you when volatility is likely. Your chart tells you where price is likely to go. Neither works well without the other. Check your chart setups before every high-impact event to know your levels.
-
Do not trade every high-impact event. Over-trading on every red event leads to whipsaw losses. The market does not owe you a clean move just because a big number dropped. Wait for confirmation before entering.
Pro Tip: Build a pre-news checklist. Before any red event, ask yourself: Is my position sized correctly? Do I have a stop in place? Am I comfortable holding through the spike? If the answer to any of these is no, reduce or exit before the release.
The calendar is a weather tool, not a crystal ball. Economic calendars help traders anticipate volatility rather than predict direction. That framing keeps you honest and protects your account.
How does forex factory compare to other market news sources?
Forex Factory is not the only option for tracking upcoming economic reports. Knowing where it fits helps you use it correctly.
| Feature | Forex Factory | Bloomberg Terminal | Direct Central Bank Feeds |
|---|---|---|---|
| Cost | Free | $24,000+ per year | Free |
| Data latency | Slight delay possible | Near real-time | Real-time |
| Customization | High (filters, time zones) | High | None |
| Community/forums | Yes | No | No |
| Ease of use | Very high | Complex | Moderate |
| Best for | Retail traders | Institutional desks | Verifying critical data |
The calendar can lag behind institutional feeds like Bloomberg Terminal during critical releases. That latency is usually measured in seconds, but seconds matter when you are trading NFP or a Federal Reserve rate decision. For those events, experienced traders verify data directly from the Federal Reserve website or the Bureau of Labor Statistics before acting.
Forex Factory’s real advantage is aggregation. It aggregates scheduled releases and breaking forex news in real time, giving retail traders a complete view of market-moving announcements in one place. No other free tool matches that combination of breadth and usability.
The forum feature is genuinely underrated. Traders post real-time reactions and analysis during major events. That community layer adds context you will not find on Bloomberg or any direct data feed.
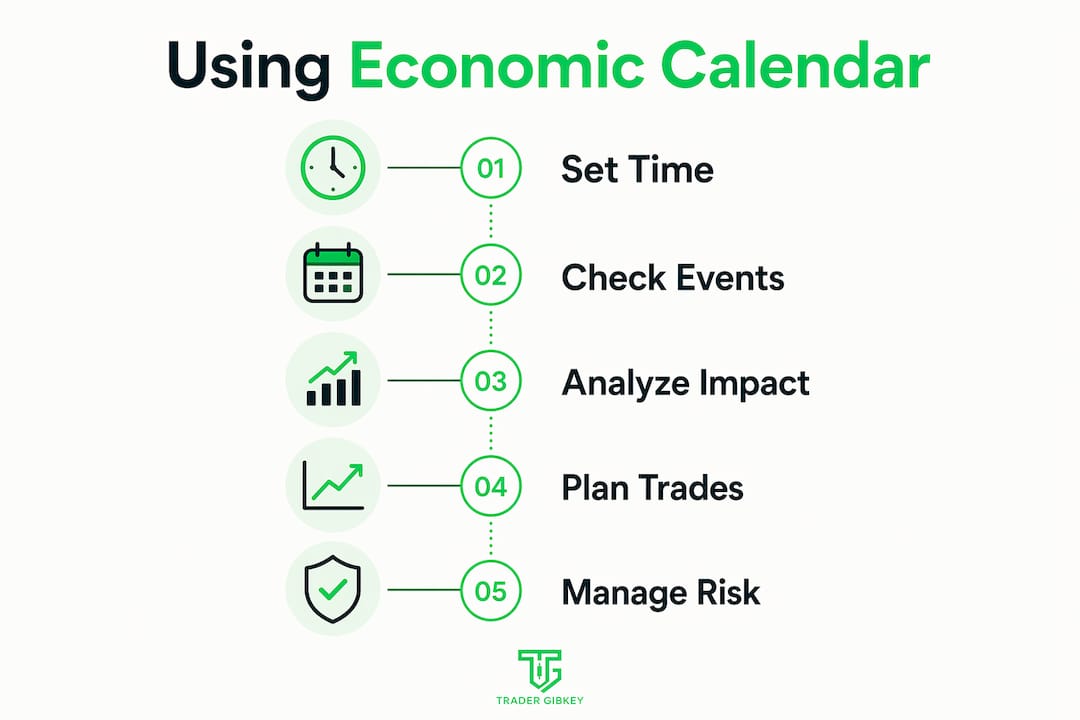
How to integrate calendar data with your trading strategy
The calendar works best as one layer in a multi-part decision process. Here is how to build that process practically.
Before the trading week starts:
- Pull up the forex calendar for traders and mark every red and orange event for your currency pairs.
- Note the forecast values and compare them to the previous figures. A large gap between forecast and previous signals a potentially volatile release.
- Identify key support and resistance levels on your charts near those event times. Price often revisits these levels after a news spike.
During the trading session:
- Integrate calendar events with chart setups and support/resistance levels before entering any trade.
- Monitor the actual versus forecast gap the moment a number drops. A large miss or beat in either direction confirms the initial move. A small deviation often produces a fake spike followed by a reversal.
- Scale down position size ahead of red events. You do not need to exit entirely, but reducing exposure limits damage if the move goes against you.
After the release:
- Check for revisions buried in the report. These often appear 30–60 seconds after the headline number and can flip the market’s initial reaction.
- Use the Forex Factory Graph view to update your understanding of the economic trend. One data point rarely changes the bigger picture.
Success comes from integrating calendar data with fundamental and technical analysis. Relying on news events alone is one of the fastest ways to blow up an account. The calendar gives you timing. Your analysis gives you direction. Together, they give you a trade.
Pro Tip: Check the proven forex tips from experienced traders who already use the economic calendar as a core part of their risk management process. The pattern recognition you build from that habit compounds over time.
Key takeaways
The Forex Factory economic calendar is most effective when used as a risk management and trade timing tool combined with technical and fundamental analysis, not as a standalone entry signal.
| Point | Details |
|---|---|
| Color codes signal risk level | Red events carry the highest volatility risk; reduce or close positions before them unless you trade volatility. |
| Actual vs. forecast gap drives moves | The bigger the gap between actual and forecast, the stronger the likely price reaction. |
| Revisions matter as much as headlines | Data revisions often produce more sustained moves than the initial headline release. |
| Filters prevent overtrading | Set currency and impact filters to see only what is relevant to your active pairs. |
| Supplement with direct sources | For critical events like Fed decisions, verify data with the Federal Reserve or Bureau of Labor Statistics directly. |
What 18 years of news trading taught me about this calendar
I have been using economic calendars in live trading for a long time, and the Forex Factory version remains the one I open first every morning. Not because it is perfect, but because it is fast, free, and covers everything I need at a glance.
Here is the honest truth most guides skip: the calendar does not make you money. Your reaction to it does. Early in my trading, I treated every red event like a guaranteed setup. I would watch NFP drop, see a big beat, and buy immediately. Sometimes it worked. More often, I got caught in the spike and reversal that follows when the market was already positioned for the beat.
The shift that changed my results was simple. I stopped trading the number and started trading the chart after the dust settled. I use the calendar now to know when to stay flat, when to tighten stops, and when to wait for a clean setup post-news. That patience is worth more than any single trade.
Customizing filters was the other turning point. Once I stopped watching every currency and every impact level, my focus sharpened. I stopped feeling like I was missing something every hour. The calendar became a planning tool instead of a source of anxiety.
If you are newer to this, start with one currency pair and track only its red events for a month. Watch how price behaves before, during, and after each release. That observation builds the instinct no article can fully teach you.
— Gabriel
Take your calendar skills further with Tradergibkey
Reading the Forex Factory economic calendar is one skill. Knowing exactly what to do with that information in a live trade is another. Tradergibkey’s courses and mentorship programs are built around practical, real-market application, not theory.
With over 18 years of live trading experience, Tradergibkey teaches you how to combine economic calendar data with price action strategies that actually hold up under pressure. The community gives you a space to ask questions, review setups, and build the discipline that separates consistent traders from the rest. If you are ready to stop guessing around news events and start trading them with a clear process, explore the courses and mentorship at Tradergibkey today.
FAQ
What does the red color mean on forex factory?
Red indicates a high-impact event with the potential to cause significant market volatility. Traders treat these releases as risk management checkpoints and often reduce position size before them.
How do i set the correct time zone on forex factory?
Click the time displayed at the top of the calendar and select your local time zone from the dropdown. Every event will then display in your local time automatically.
Should i trade every high-impact news event?
No. Over-trading every red event leads to whipsaw losses. Wait for the initial spike to settle and confirm a direction before entering a position.