
A trading approach that works is defined as a rules-based method with a statistically proven edge, clear risk parameters, and a structure that fits your psychology well enough to execute consistently. Most traders never find one because they skip the data work and jump straight to copying someone else’s setups. The industry term for this process is “edge discovery,” and it sits at the foundation of every profitable trading strategy worth following. You do not need a secret indicator or a complex algorithm. You need your own trade data, a filtering process, and the discipline to build something simple that you can actually trust.
How to find a trading approach that works: the prerequisites
Before you can identify your edge, you need clean data to analyze. That means keeping a detailed trade journal from day one. Every entry should capture the setup type, the time of day, the R-multiple result, and a market condition tag such as Trending, Ranging, or High Volume. Without these tags, your data is just a list of wins and losses with no pattern to extract.
Here is what your preparation checklist should include:
- A structured trade journal that records setup name, entry time, exit time, R-multiple, and market condition for every trade
- A focused instrument list of one to three markets maximum, so your sample data stays concentrated and comparable
- A reliable analytics platform such as TradeZella to filter and visualize your trade data by tag combinations
- A minimum sample size of at least 50 trades before drawing any conclusions, with 15 to 20 trades per individual filter segment for statistical reliability
- A performance calculator to compute profit factor, average R, and win rate per segment
The reason you limit your markets is simple. Spreading across ten instruments dilutes your sample and makes it nearly impossible to spot meaningful patterns. Focus creates clarity. Tagging trades by market conditions is what separates traders who find their edge from those who keep searching indefinitely.
Pro Tip: Start your journal before you think you are ready. Even messy early data is better than no data. You can always clean it up, but you cannot go back and recreate trades you never recorded.

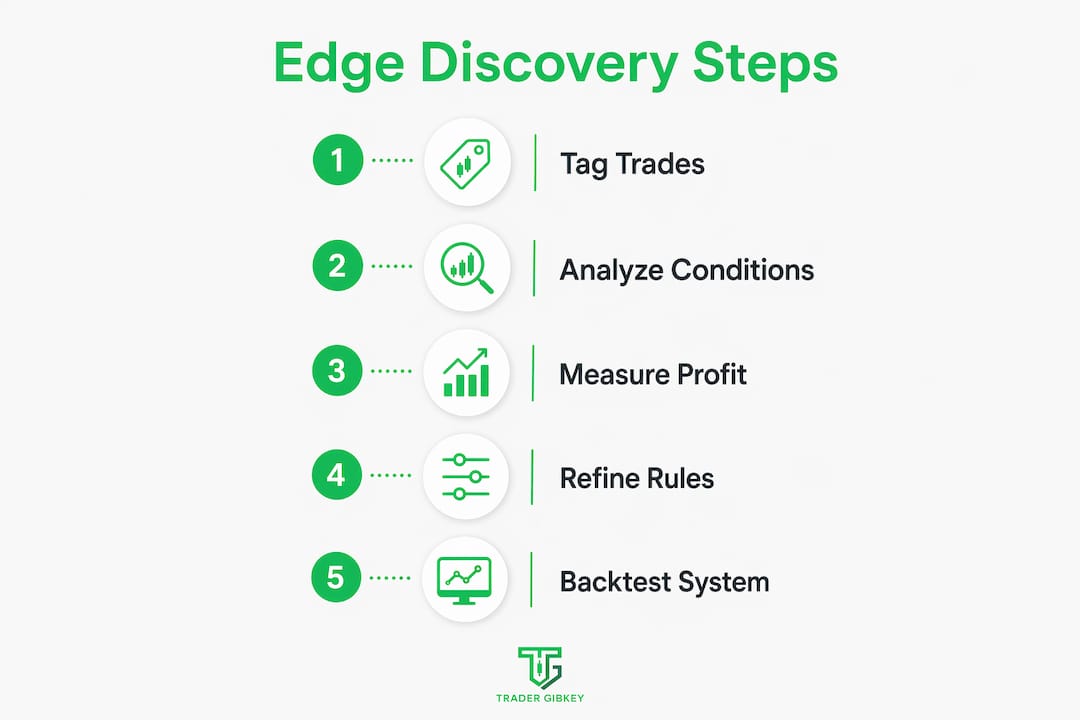
What does a step-by-step edge discovery process look like?
Finding a repeatable edge requires tagging trades by setup, time, and market conditions over at least 30 trading sessions, targeting profit factor above 2.0 over 15 or more trades. That number matters because a profit factor below 1.5 is fragile and will likely collapse under real execution pressure.
Follow this sequence:
- Filter by setup type. Group all trades sharing the same entry pattern, such as a breakout retest or a supply zone rejection. Calculate the profit factor and average R for each group. Setups with profit factor above 2.0 are candidates worth developing further.
- Analyze time-of-day performance. Within your strongest setups, break results down by session hour. You will often find that the same setup performs well during the London open and poorly during the New York close. These windows are your golden hours.
- Apply market condition tags. Cross-reference your best setup-and-time combinations with your condition tags. A breakout retest in a trending market may show a 2.4 profit factor. The same setup in a ranging market may show 0.8. That difference is your edge.
- Write an edge statement. Summarize your finding in one sentence. Example: “My supply zone rejection setup, taken during the first two hours of the London session in a trending market, produces a profit factor of 2.3 over 22 trades.”
- Verify the sample. Confirm you have at least 15 to 20 trades per filter segment before trusting the result. Fewer trades means the number could be statistical noise.
Here is what a basic edge analysis table looks like in practice:
| Setup | Market condition | Profit factor | Sample size |
|---|---|---|---|
| Supply zone rejection | Trending | 2.3 | 22 trades |
| Supply zone rejection | Ranging | 0.8 | 18 trades |
| Breakout retest | Trending | 1.9 | 16 trades |
| Breakout retest | Ranging | 1.1 | 14 trades |
The table above shows something most traders never see clearly. The setup itself is not the edge. The specific combination of setup, time window, and market condition is where the statistical advantage lives.
Pro Tip: Do not discard setups with low profit factors immediately. Sometimes a small rule change, like tightening your entry trigger, transforms a 1.2 into a 2.1. Test the adjustment on a fresh sample before deciding.
How do you build a rules-based system around your edge?
Discovering an edge and building a system around it are two different things. A setup tells you when to enter. A system defines your position size, stop placement, profit target, and what you do when the trade goes against you. Building a repeatable system involves a 7-phase process from hypothesis to iterative refinement, with forward testing as a non-negotiable step.
The 7 phases are:
- Hypothesis: State what you believe works and why, based on your edge data
- Rule definition: Write every rule in black and white. Entry trigger, stop-loss placement, target, and trade management steps
- Backtesting: Apply the rules to historical data to check consistency
- Forward testing: Run the system on a demo account in real time to catch execution gaps
- Live small testing: Trade the system with minimal real capital to experience real emotions
- Evaluation: Compare live results to forward test results using your journal
- Refinement: Adjust one variable at a time based on data, not feelings
One critical warning here. Backtests may show a 65% win rate, but that number can drop to 48% in live trading once slippage, hesitation, and real market noise enter the picture. This is not failure. It is normal. The solution is simplified rules that are easy to execute under pressure, not more complex ones.
The majority of long-term profitability comes from precise management of exits and position sizing rather than entries alone. Most traders obsess over entry signals and neglect the part of the system that actually determines how much they keep.
Here is a quick comparison of common system-building mistakes versus better alternatives:
| Common mistake | Better alternative |
|---|---|
| Optimizing for highest backtest win rate | Optimizing for robustness across multiple market conditions |
| Using 10+ indicators for confirmation | Using 2 to 3 independent signals to reduce false alarms |
| Changing rules after a losing streak | Reviewing only after a statistically meaningful sample |
| Ignoring position sizing | Risking less than 1% of account equity per trade |
Risk management rules must be integral to the system from the start, not added later. Defining your response to a losing streak before it happens is what keeps you in the game long enough to let your edge play out.
Does your trading approach actually fit who you are?
A strategy must fit your personality, emotional tolerance, and schedule for consistent execution over time. This is not soft advice. It is a hard performance variable. A high-frequency scalping approach is genuinely unsuitable for a trader who cannot maintain focus during market hours. Swing trading may fit that same trader far better.
Ask yourself these questions honestly:
- Can you sit through a 20-trade drawdown without abandoning the system?
- Does your schedule allow you to trade during your identified golden hours?
- Does the strategy’s win rate match your emotional need for frequent feedback?
- Are you comfortable holding positions overnight, or does that create anxiety that affects your next-day decisions?
Some institutional trend followers operate at win rates as low as 35%, driven by rare outsized wins. That approach works mathematically. But if a 35% win rate sends you into revenge-trading mode after three losses in a row, the math is irrelevant. Your psychology will override the system every time.
One underused solution is combining multiple low-correlation strategies. A combined portfolio approach can dramatically increase resilience, with one documented example achieving a Return/Drawdown ratio of over 41.0x. You do not need to run ten strategies. Two or three with different market condition profiles can smooth your equity curve significantly and reduce the emotional weight of any single drawdown.
“Stop chasing the perfect strategy. The trader who executes an imperfect system consistently will always outperform the trader who searches endlessly for a flawless one.”
Review your edge statement monthly. Markets shift. A trending-market edge may underperform during a prolonged ranging period. Catching that drift early through your performance review process lets you adapt before the damage compounds.
Key takeaways
A trading approach that works requires a statistically validated edge, a rules-based system built around it, and a personal fit strong enough to sustain consistent execution through drawdowns.
| Point | Details |
|---|---|
| Edge discovery comes first | Tag trades by setup, time, and market condition before building any system. |
| Profit factor above 2.0 matters | Target this threshold over at least 15 trades per filter segment for reliability. |
| Simplicity beats complexity | Two to three confirmation signals outperform ten indicators in live execution. |
| Personal fit is a performance variable | Match timeframe and win rate expectations to your emotional tolerance and schedule. |
| Combine low-correlation strategies | Multiple imperfect strategies with different profiles create smoother equity curves. |
What 18 years of live trading taught me about finding your edge
Here is the uncomfortable truth I have seen play out with traders at every level. The ones who struggle longest are not the ones who lack intelligence. They are the ones who keep looking for a strategy that removes all uncertainty. For real. They want a setup that is always right, a system that never draws down, and a method that feels comfortable from day one.
That strategy does not exist. What does exist is a method that gives you a statistical advantage in specific conditions, and the discipline to take only those conditions. When I started filtering my own trades by time and market condition, I found that roughly 30% of my setups were generating over 80% of my profits. The other 70% was noise I was trading out of boredom or FOMO.
The most common misconception is that a working strategy requires secret complex indicators. In practice, simplicity and mechanical rules beat complexity every time. The edge lies in consistent mechanical execution of a known statistical advantage, not in finding a smarter entry signal.
My honest advice: trust the data over your gut, especially early on. Your gut is running on emotion. Your journal is running on facts. Build the system, test it properly, and give it enough trades to prove itself before you change anything. Incremental improvement over time beats the endless search for a perfect method every single time.
— Gabriel
Ready to build your trading approach with real support?
If you have been spinning your wheels trying to find a method that actually holds up in live markets, you do not have to figure it out alone. Tradergibkey offers structured courses covering strategy development, risk management, backtesting, and live execution, built on over 18 years of real market experience.
The Tradergibkey community gives you accountability, direct feedback on your setups, and a structured path from confusion to confidence. Whether you are just starting out or rebuilding after a rough stretch, the courses and mentorship at Tradergibkey are designed to get you executing a system you actually trust. Check out the full offering and find the right starting point for where you are right now.
FAQ
What is a trading edge, exactly?
A trading edge is a specific combination of setup, time window, and market condition where your historical data shows a profit factor above 2.0 over at least 15 trades. It is not just an entry signal.
How many trades do I need before my data is reliable?
You need a minimum of 50 total trades for overall analysis, with at least 15 to 20 trades per individual filter segment to draw statistically meaningful conclusions.
Can a low win rate strategy actually be profitable?
Yes. Some institutional trend followers operate at win rates as low as 35% and remain highly profitable because their average winning trade is significantly larger than their average losing trade.