
Most traders see a sudden spike beyond a key level and assume it was random noise. It wasn’t. That move was a liquidity sweep, the formal term used in Smart Money Concepts (SMC) trading to describe an intentional, institutional price push designed to trigger retail stop orders before reversing. Understanding this pattern changes how you read a chart. Instead of getting caught on the wrong side of a spike, you start reading those moves as entry signals. This guide walks you through the anatomy of a sweep, how to confirm one in real time, and how to trade it with precision.
Table of Contents
- Key Takeaways
- What a liquidity sweep actually is
- How to identify a liquidity sweep in real time
- Entry and exit strategies after a sweep
- Liquidity sweeps in your broader trading plan
- My honest take on trading sweeps
- Take your sweep trading further with Tradergibkey
- FAQ
Key Takeaways
| Point | Details |
|---|---|
| Sweeps signal institutional intent | Price pushing beyond a key level then rejecting reveals smart money absorbing liquidity. |
| Confirmation before entry | Wait for a candle close back inside prior structure before pulling the trigger. |
| Volume separates sweeps from breakouts | A volume spike during the push followed by a drop confirms a sweep, not a continuation. |
| Multi-timeframe alignment matters | Higher timeframe sweep context combined with lower timeframe entry signals improves risk/reward. |
| Patience is the edge | Entering during the sweep instead of after it is the single most common and costly mistake. |
What a liquidity sweep actually is
A liquidity sweep, sometimes called a stop hunt in older trading literature, occurs when price pushes beyond a significant high or low, triggers the stop orders clustered there, then quickly reverses and closes back within the prior range. The reversal confirmed by a candle close inside previous structure tells you the push was not a genuine breakout. It was a collection run.
Here is why it happens. Institutional traders need massive order sizes filled with minimal slippage. Retail stop orders sitting just beyond swing highs and lows provide that liquidity. By pushing price into those zones, institutions absorb retail stops to fill their own large positions, then drive price in the opposite direction with force.
The anatomy of a sweep follows a consistent pattern:
- Price trends toward a well-known level such as a swing high, equal highs, or a prior support zone
- A sharp candle pushes price beyond that level
- Stop orders trigger, creating a surge of orders for institutions to absorb
- Price rejects and closes back inside the prior range within one to three candles
- A directional move begins in the opposite direction
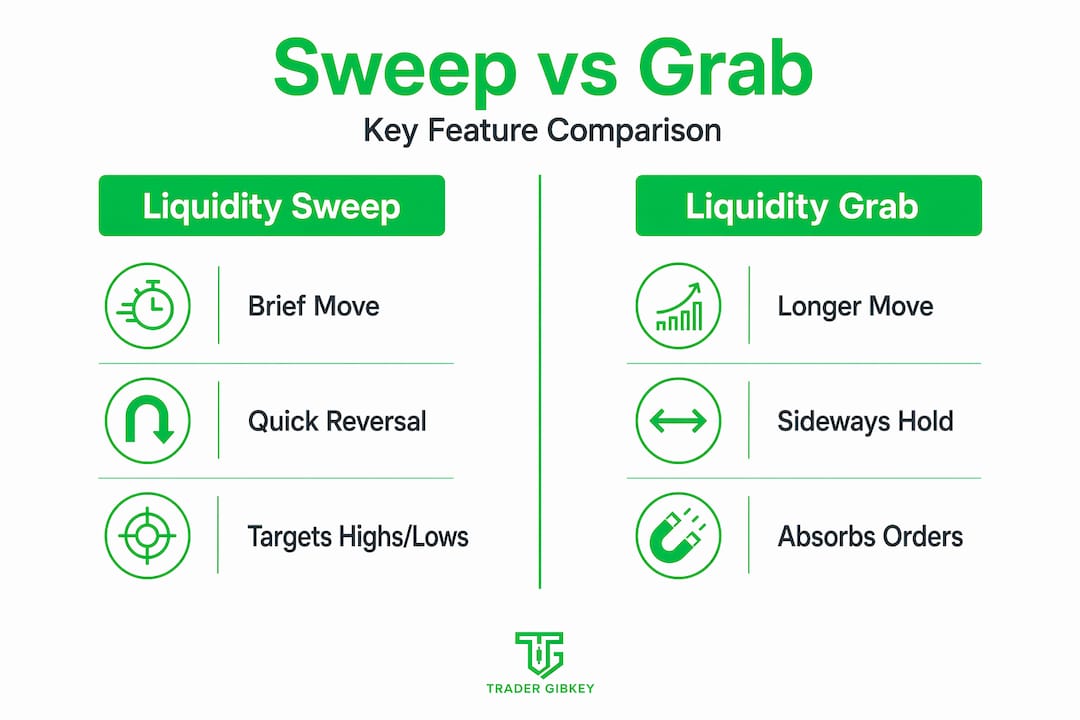
It helps to know the difference between a sweep and a liquidity grab. They are closely related, but not identical.
| Feature | Liquidity sweep | Liquidity grab |
|---|---|---|
| Duration | Brief push, quick reversal | Can be a single wick or micro-spike |
| Candle close | Closes back inside prior structure | May close slightly outside |
| Institutional signal | Strong reversal intent | Less conclusive on its own |
| Context required | Higher timeframe confirmation | Often needs additional confluence |
| Follow-through | Larger directional move expected | Smaller or unclear follow-through |
Equal highs and lows are the most predictable liquidity targets. When you see price repeatedly stall at the same level, you are looking at a magnet for institutional attention. Mark those zones. They form the foundation of your sweep watchlist.
How to identify a liquidity sweep in real time
Spotting a sweep on a live chart takes more discipline than spotting it in hindsight. The pattern looks obvious after the fact. In real time, you need to resist acting until the right signals stack up.
Start with your key levels. Before anything else, mark:
- Equal highs and equal lows on the daily or 4-hour chart
- Prior swing highs and lows that have been tested more than once
- Support and resistance zones with obvious stop clusters
- Fair value gaps (FVGs) sitting near those levels
Once price approaches a marked level, watch for these confirmation signals before you do anything:
- The wick. Price pushes beyond the level and leaves an extended wick. The candle body stays near or inside the prior range.
- The close. A candle closes back inside the previous structure. This is your first hard signal. Entering after acceptance rather than at the wick extreme reduces false entries significantly.
- Change of Character (CHoCH). On a lower timeframe, price breaks a recent swing in the opposite direction. This confirms the structural shift.
- Fair Value Gap creation. The rejection candle creates a FVG in the new direction, showing displacement. Combining FVGs with sweeps signals institutional involvement.
- Volume behavior. Volume increases sharply as stops trigger during the push, then drops off as price reverses. A genuine breakout shows sustained volume. A sweep does not.
Pro Tip: Never enter during the candle that is sweeping the level. That candle is still live. Institutions may push further before the reversal begins. Wait for the sweep candle to close, then look for confirmation on the next one or two candles.
A common misread is confusing a sweep with a failed breakout or a genuine continuation. The difference comes down to the close and the volume. Sweep wicks are spikes where the close price remains within the prior range and volume drops on the reversal. If volume stays elevated and price holds beyond the level, you are likely watching a real breakout, not a sweep.
Entry and exit strategies after a sweep
Once you have confirmed a sweep with at least two of the signals above, the trade setup begins. This is where execution matters.
Entry approach. Drop to a lower timeframe (15-minute or 5-minute) and look for a CHoCH or an order block reclaim in the new direction. Wait for price to pull back into the FVG or order block created by the rejection move. That pullback is your entry zone, not the wick extreme.
Here is a practical entry checklist:
- Sweep confirmed on the 4-hour or 1-hour chart
- CHoCH visible on the 15-minute chart
- FVG or order block identified post-sweep
- Price pulls back into that zone
- Entry candle closes in your favor before you commit
Stop loss placement. Place your stop just beyond the sweep wick, not at the level itself. The wick marks where institutions absorbed liquidity. Price rarely needs to revisit that exact point. A few pips or points of buffer beyond the extreme gives you protection without excessive risk.
Targets. Your first target is the opposing liquidity pool. If price swept a swing high and reversed down, your initial target is the nearest equal lows or significant support. Higher timeframe sweep setups carry stronger institutional weight and typically produce larger moves, so adjust target distance by timeframe.

Pro Tip: Align your trade direction with the higher timeframe order flow before entering. If the daily chart is bullish and a sweep of lows occurs on the 4-hour chart, you have institutional alignment in your favor. That confluence is what separates a decent setup from a high-probability one. For deeper reading on institutional trader indicators, the approach of layering timeframe context is well worth studying.
Common execution mistakes to avoid:
- Entering during the sweep candle before it closes
- Ignoring the broader market structure and trading sweeps in isolation
- Setting stops too tight, right at the level rather than beyond the wick
- Taking every sweep setup regardless of higher timeframe context
- Expecting every sweep to produce a massive reversal without further confirmation
Liquidity sweeps in your broader trading plan
A single sweep signal is a starting point, not a complete trading plan. The traders who get consistent results from this approach treat sweeps as one layer in a multi-part decision process.
Within a Smart Money Concepts framework, sweeps work alongside order blocks and fair value gaps to create high-probability setups. The sequence typically runs like this: price sweeps a liquidity zone, creates a FVG on the rejection, and then pulls back into an order block on a lower timeframe. Sweeping liquidity into order blocks followed by FVG creation signals institutional entry. That full chain gives you far more confidence than a sweep signal alone.
Here is where liquidity sweeps fit within a broader market reading framework:
- Market direction filter. Sweeps of lows in a bullish structure are continuation setups. Sweeps of highs in a bearish structure are the same. Trading against the higher timeframe structure dramatically lowers your odds.
- Session timing. London and New York session opens are the most common times for sweeps to occur. Institutional activity peaks during these windows.
- News events. High-impact news can trigger a sweep of a major level before price moves strongly in one direction. These setups are legitimate but carry higher volatility.
On the topic of automated processes, it is worth noting that automated sweep strategies in treasury and cash management share conceptual DNA with what happens in the market. Both involve moving liquidity to where it is most needed, the market just does it at the expense of retail stop orders. The principle of sweeping to optimize flow applies in both contexts.
Charting platforms like TradingView let you mark liquidity zones, FVGs, and order blocks manually or with community scripts. The tools matter less than the habit of mapping your levels before each session and updating them as structure shifts.
My honest take on trading sweeps
I’ve watched traders blow accounts chasing sweeps for years. The setup looks so clean in theory that they jump in the moment price touches a key level, without waiting for any confirmation. Then the candle extends further, stops trigger, and they exit at a loss right before the real reversal. The frustration is real, and I’ve felt it too.
What changed my approach was accepting that patience is the differentiator between traders who profit from sweeps and traders who get swept themselves. The setup is not complete until the sweep is done and confirmed. Jumping in early is trading your anticipation, not the chart.
I’ve also found that once you start reading the market through the lens of institutional footprints, you stop feeling like the market is against you. The sweep is not random chaos. It is a predictable, repeatable mechanism. That shift in perspective alone changed how I managed both entries and the emotional weight of being stopped out. Getting stopped near a sweep wick is not a failure of your analysis. It just means you entered before the confirmation was complete.
My practical advice: paper trade sweep setups for at least 30 sessions before committing real capital. Not because the concept is hard, but because your discipline under pressure is what determines results, not your knowledge of the pattern.
You can also avoid a lot of early mistakes by studying common premature entry traps that show up in fast-moving setups. Sweep trading and scalping share some of the same psychological pitfalls.
— Gabriel
Take your sweep trading further with Tradergibkey
If this breakdown clicked for you and you want to go deeper, Tradergibkey has built structured courses and live mentorship programs specifically for traders who want to apply price action and Smart Money Concepts in real markets.
With over 18 years of live market experience behind the teaching, the courses go beyond theory. You get live trade examples, real chart walkthroughs, and a community of traders working through the same setups you are. Liquidity sweeps, order blocks, FVGs, and multi-timeframe confluence are all covered with the kind of depth that actually changes how you trade. If you’re ready to move from studying concepts to applying them consistently, explore what Tradergibkey’s trading courses offer and see whether the program fits where you are in your trading right now.
FAQ
What is a liquidity sweep in trading?
A liquidity sweep occurs when price pushes beyond a key high or low to trigger stop orders, then reverses and closes back inside the prior range. It reflects institutional order filling, not random price movement.
How do you confirm a liquidity sweep before entering a trade?
Wait for a candle to close back inside the prior structure, then look for a Change of Character (CHoCH) or Fair Value Gap on a lower timeframe. Volume dropping after the initial push also confirms a sweep rather than a breakout.
Where should you place your stop loss on a sweep trade?
Place your stop just beyond the sweep wick extreme, not at the level itself. This protects against a second push into the liquidity zone while keeping your risk defined and manageable.