Most traders spend months collecting indicators, buying signal services, and memorizing patterns from a candlestick patterns cheat sheet, only to keep losing. The problem is rarely the tools. The problem is a fundamental misunderstanding of what price action trading actually is. It is not pattern spotting. It is reading the raw story of buyer and seller battles as they unfold on the chart, understanding market psychology, and making decisions grounded in structure, context, and institutional order flow. This guide cuts through the noise and gives you a real framework to trade with clarity.
Table of Contents
- Key takeaways
- Foundations of price action trading
- Reading price action candlestick patterns
- Entry, exit, and risk management
- Mindset and discipline in price action trading
- Price action across markets and timeframes
- My honest take on where most traders go wrong
- Take your price action skills further with Tradergibkey
- FAQ
Key takeaways
| Point | Details |
|---|---|
| Price action is market psychology | Reading raw price movement reveals who controls the market, not just what shape a candle makes. |
| Structure comes before patterns | Higher highs, lower lows, and key zones must frame every trade decision you make. |
| Context makes patterns valid | A pin bar at a key level means something. The same pin bar mid-range means almost nothing. |
| Stop losses belong at structural levels | Place stops where the setup is invalidated, not at a fixed distance from your entry. |
| Discipline filters the noise | Waiting for high-probability setups at key zones is the skill that separates consistent traders from gamblers. |
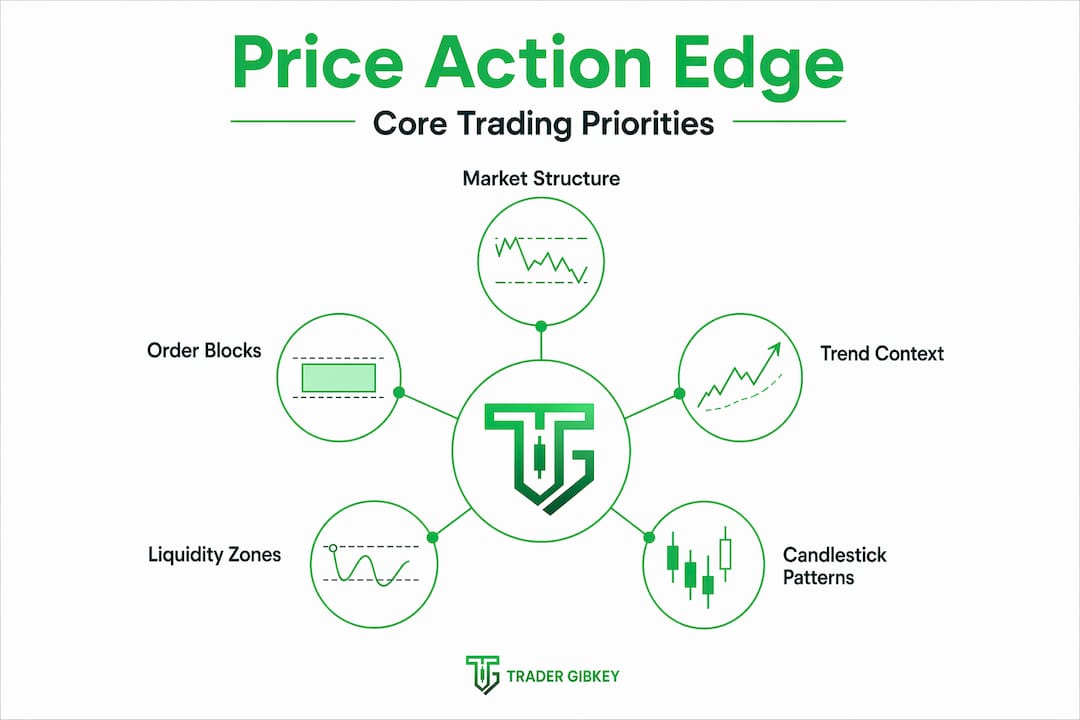
Foundations of price action trading
Before you can read a single candle correctly, you need to understand market structure. Structure is the skeleton beneath every chart. Price moves in sequences: higher highs and higher lows signal an uptrend, while lower highs and lower lows signal a downtrend. When you can identify that sequence clearly, you already know more than most retail traders who are busy counting moving average crossovers.
Support and resistance zones are where the real battles happen. These are not just lines on a chart. They are price levels where large participants have previously placed significant orders, and where they are likely to do so again. Think of them as psychological battlegrounds where buyers and sellers have unfinished business.
Beyond basic support and resistance, there are more precise concepts worth understanding.
| Concept | What most traders think | What it actually means |
|---|---|---|
| Order block | A random consolidation zone | An area where institutions placed large orders, often causing sharp moves |
| Fair Value Gap | A gap to be filled automatically | An imbalance in price delivery that price may return to rebalance |
| Supply/demand zone | Same as support/resistance | A zone with institutional footprints, not just a price memory |
| Mid-range price | A neutral area to trade | One of the lowest probability areas to enter any trade |
Effective 2026 strategies prioritize market structure with higher highs and higher lows combined with institutional order flow zones rather than random price levels. The most reliable setups occur when price pulls back to an order block or a previously tested zone, not when it floats in the middle of a range.
Pro Tip: If you cannot clearly identify whether price is trending or ranging before you look for a setup, you are not ready to enter a trade. Structure identification is the first filter, not an afterthought.
Reading price action candlestick patterns
Candlestick patterns are not magic signals. They are visual representations of the ongoing battle between buyers and sellers within a specific time period. The body of a candle tells you where price opened and closed. The wicks tell you where price was rejected. Together, they reveal who won the period and how convincingly.
When you understand candlestick anatomy this way, patterns become meaningful. Patterns are graphical manifestations of liquidity shifts, institutional order flow, and trader psychology rather than standalone predictive tools. That reframing changes everything about how you use them.
Three patterns deserve the most attention because they appear frequently and carry real information when read in context.
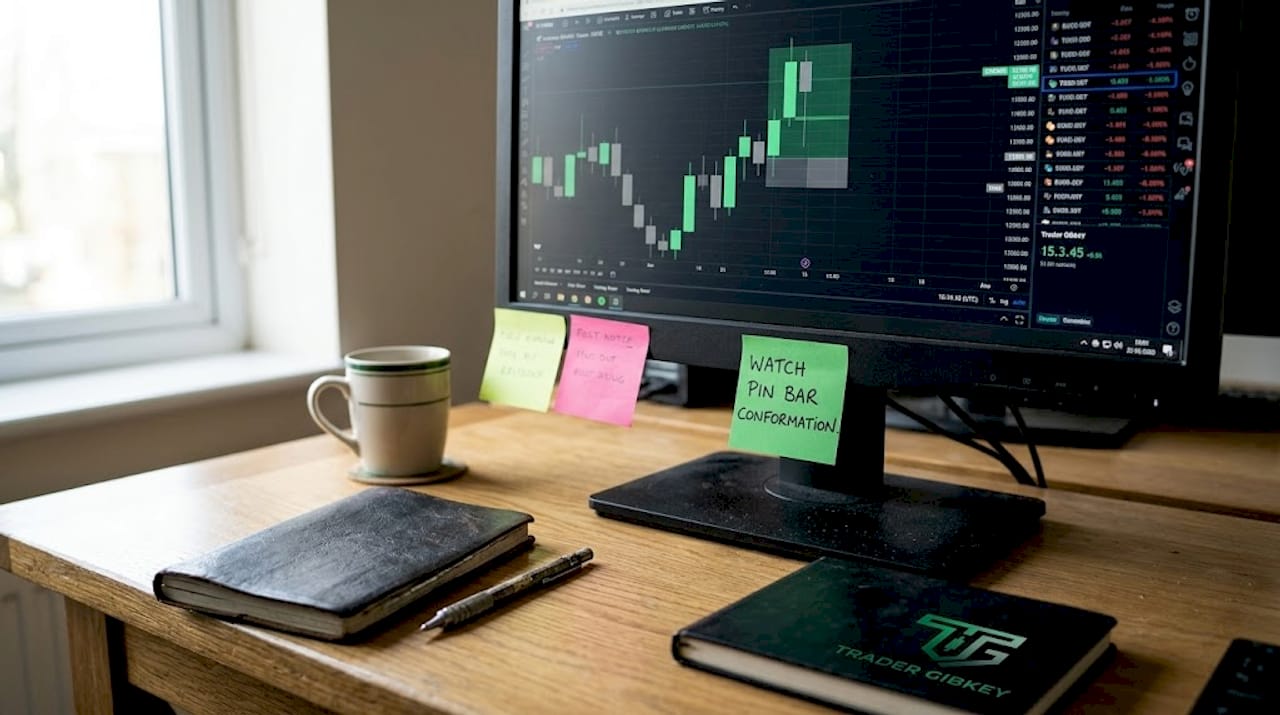
The pin bar has a small body and a long wick. The wick shows that price moved aggressively in one direction but was rejected and pushed back. A bullish pin bar at support signals buyers overcoming sellers, making it a reliable entry confirmation when the broader structure agrees.
The engulfing candle shows a candle that completely swallows the body of the previous one. A bullish engulfing after a downtrend at a key demand zone suggests a momentum shift. The sellers tried and the buyers overwhelmed them in a single candle.
The inside bar is a candle that forms entirely within the range of the previous candle. It signals indecision and compression. When it appears after a strong move at a key level, it often precedes a breakout in the direction of the trend.
Here is what to look for before acting on any of these signals:
- The pattern must appear at a structurally significant zone, not mid-range
- The higher timeframe trend must support the direction of the signal
- The wick-to-body ratio should be convincing, not marginal
- Volume confirmation, where available, adds weight to the signal
- The risk-to-reward ratio must be favorable before you even consider entering
Pro Tip: Do not build a price action candlestick patterns library of 30 setups. Master three patterns in context and you will outperform traders who know twenty patterns without understanding any of them.
Entry, exit, and risk management
Good trade structure is where most traders fail silently. They find a pattern, jump in, set a random stop 20 pips away, and wonder why they keep getting stopped out before the move happens. The best traders combine multi-timeframe analysis for bias, key zone identification, and lower timeframe trigger entries to improve trade quality. That is not complexity. That is discipline.
Here is a step-by-step process for structuring a price action trade:
- Identify the higher timeframe trend. Use the daily or 4-hour chart to determine whether you are in an uptrend, downtrend, or range. This sets your directional bias.
- Mark key structural levels. Identify order blocks, demand and supply zones, and significant highs and lows on the higher timeframe.
- Wait for price to reach a key zone. Do not chase price mid-move. Wait for a pullback or retest of the level you identified.
- Drop to a lower timeframe for entry. Use the 1-hour or 15-minute chart to look for a price action signal confirming rejection at that zone.
- Set your stop at the structural invalidation point. If the setup is a bullish pin bar at demand, your stop goes just below the pin bar low. Stops below pin bar lows reduce premature stop-outs from normal market noise.
- Define your profit target using risk-reward. A 1:2 ratio means you risk 50 pips to target 100. Do not move your target because you feel nervous.
| Setup type | Stop placement | Profit target |
|---|---|---|
| Bullish pin bar at demand | Below pin bar low | Next structural resistance zone |
| Bearish engulfing at supply | Above engulfing candle high | Next structural support zone |
| Inside bar breakout | Below inside bar low (for long) | Measured move or next key level |
| Order block retest | Beyond the order block boundary | Previous swing high or low |
Stop losses in price action trading should be placed at logical levels that invalidate the trade setup, never at arbitrary distances. Arbitrary stops are how you donate money to the market.
Mindset and discipline in price action trading
Here is the uncomfortable truth: most traders who struggle with price action are not struggling because of a knowledge gap. They are struggling because of a discipline gap. Price action trading demands discipline to filter noise and focus on high-probability setups at key psychological battlegrounds. That means sitting on your hands for hours while subpar setups form and pass.
Treating price action as a formulaic checklist is a trap. The market does not care about your checklist. It responds to liquidity, institutional positioning, and collective trader psychology. When you try to force a pattern into a signal, your brain stops reading the chart and starts reading what you want to see.
Mindlessly identifying patterns without understanding buyer and seller dynamics is one of the most common traps for developing traders. Successful traders view patterns as evidence of crowd psychology, not as buy or sell buttons.
Common pitfalls to watch for and actively avoid:
- Overtrading low-quality setups because you feel the need to be in the market
- Moving stop losses to avoid taking a loss, which turns small losses into account-damaging ones
- Revenge trading after a losing trade, which puts you in a completely different mental state
- Ignoring the higher timeframe and trading against the dominant structure
- Treating every pattern the same regardless of where it forms on the chart
Building trading discipline takes structured practice. Simulation trading, journaling every setup, and working with a mentor who gives honest feedback are the three most reliable ways to develop the filter you need. Understanding trading psychology is not optional for discretionary traders. It is the foundation everything else rests on.
Pro Tip: After every losing trade, ask yourself one question: “Did I follow my process?” If yes, the loss is acceptable. If no, that is the real problem to fix, not the trade itself.
Price action across markets and timeframes
One of the most practical advantages of price action strategies is their universality. Supply and demand dynamics apply equally to forex price action, stock price action, crypto, and commodities across all time horizons. The same order block concept that works on a EUR/USD daily chart works on an Apple stock 4-hour chart. The market structure principles do not change because the ticker does.
Different trading styles use price action differently, and that is worth understanding.
Swing traders hold positions for days to weeks, aligning lower timeframe entries with the structural trend visible on daily charts. A swing trader might identify a bullish structure on the daily, wait for a pullback to a demand zone, then use the 4-hour chart to time the entry precisely.
Day traders work on the 15-minute and 1-hour charts, using the daily or 4-hour for directional bias and looking for intraday setups at pre-marked levels. Position traders zoom out further, using weekly charts for structure and daily charts for entries, holding trades for weeks to months.
Indicators and price action are not mutually exclusive. Professionals use price action for core structural analysis and add indicators secondarily for confirmation, never as the primary signal. Volume is the one additional tool worth integrating because it confirms whether a move at a key level has real participation behind it.
Pro Tip: If you are adding a third or fourth indicator to “confirm” a signal, you are not gaining confidence. You are covering up uncertainty. One or two tools used well beats six tools used poorly every time.
My honest take on where most traders go wrong
I have watched hundreds of traders go through the same cycle. They discover price action, get excited about candlestick patterns, and spend weeks building a setup list. Then the market humbles them, and they blame the patterns.
In my experience, the patterns were never the problem. The problem was that they were reading a map instead of understanding the territory. Mastering price action means shifting from indicator-based map-reading to genuine territory understanding of raw price and order flow. That shift takes time and honest self-assessment.
What I have found actually works is combining market structure with institutional concepts like order blocks and fair value gaps, then waiting with patience for price to come to your level. Not chasing. Not forcing. The traders I have seen grow the fastest are not the ones who found the best pattern. They are the ones who built the best filter.
Risk management is not a section you read once and check off. It is the thing that keeps you in the game long enough to get good. Protect your capital like it is the only thing standing between you and quitting, because it is.
The real skill in price action trading is not recognizing setups. It is recognizing when NOT to trade. That lesson takes longer to learn than any pattern, and it matters more than all of them combined.
— Gabriel
Take your price action skills further with Tradergibkey
If you have been trading on instinct, copying signals, or bouncing between indicator systems without consistent results, there is a better path.
Tradergibkey was built specifically for traders who are serious about developing a real edge. With over 18 years of live market experience, the focus at Tradergibkey is on teaching you to think like a trader, not just follow rules. The structured courses cover market structure, institutional order flow, risk management, and the psychological discipline that separates consistent traders from the rest. You also get access to a community of traders who hold each other accountable. If you are ready to stop guessing and start reading markets with confidence, this is where that transformation begins.
FAQ
What is a good trading mentor vs. a bad one?
A good mentor focuses on risk management, psychology, and building your personal edge. They teach you to think independently, have real skin in the game, and measure success by long-term results, not hype. A bad mentor promises easy money, sells expensive courses built around secret indicators, pushes signals or copy-trading, and disappears when markets get tough. Their real business is selling dreams, not creating skilled traders.
How much does a good trading mentor cost?
Expect to pay $1,000 to $2,000 or more for a high-quality mentor or structured program. Cheap mentors are usually the most expensive option in the long run because the losses you take with real money while following bad advice far exceed the upfront cost of quality education. Never invest more than you can genuinely afford.
Can price action trading work in forex and stocks?
Yes. Price action principles are universal because supply and demand dynamics operate the same way across all liquid markets. Whether you are trading forex price action on EUR/USD or stock price action on major equities, the same structural concepts apply. The timeframes and volatility profiles differ, but the underlying logic does not.