
An ineffective trading system is defined as any method that fails to maintain positive expectancy across a statistically meaningful sample of trades. Most traders never get a clear answer on whether their system is broken or just going through a rough patch. The result is either premature abandonment of a working strategy or prolonged losses from a genuinely failing one. This recognize ineffective trading systems guide gives you the objective criteria, diagnostic checklists, and performance benchmarks to tell the difference. Tradergibkey has spent over 18 years in live markets watching traders make both mistakes, and the fix always starts with data, not feelings.
What are the key metrics for identifying poor trading strategies?
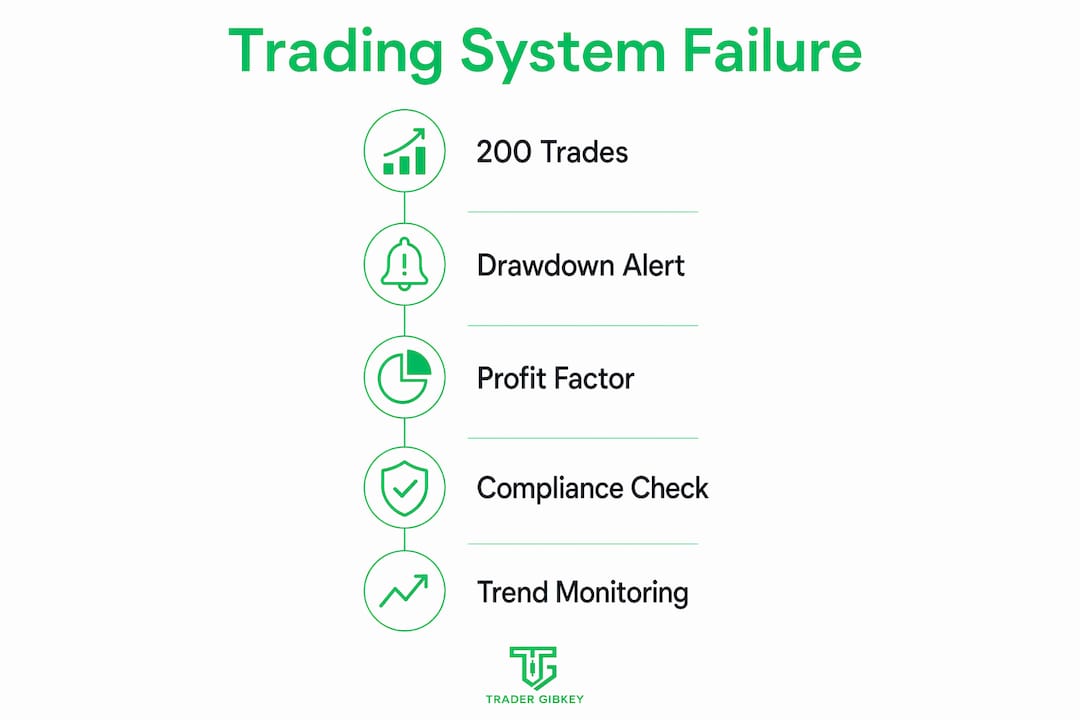
Performance evaluation requires a minimum sample size before any conclusion is valid. 200 trades is the industry standard for statistically meaningful system evaluation. Traders who abandon a strategy below 100 trades are almost always reacting to normal variance, not structural failure.
The core metrics you need to track are profit factor, drawdown depth, win rate, and expectancy.
Profit factor thresholds work as follows:
- Below 0.5: Cut immediately. These are impulse trades with no statistical edge, and setups at this level should be removed without probation.
- 0.5–0.7 over 40+ trades: Serious candidate for removal. The system is losing money faster than it earns.
- 0.8–1.1: Needs investigation. This range sits close to breakeven and requires deeper context analysis.
- Above 1.2: Acceptable baseline, though market regime and execution quality still matter.
Win rate alone tells you very little. A system with a 35% win rate and a 3:1 reward-to-risk ratio has positive expectancy. A system with a 65% win rate and a 0.5:1 reward-to-risk ratio destroys capital. Expectancy, which combines win rate and average win/loss size, is the number that actually matters.
Drawdown is the other critical signal. A drawdown exceeding the 99th percentile of your historical expectations is a mandatory trigger to reduce position size and audit the system. That does not mean kill the system immediately. It means stop adding risk until you know what is happening.

Pro Tip: Build a simple spreadsheet that tracks rolling expectancy every 20 trades. A consistent downward trend across 60+ trades is a far more reliable signal than any single losing week.
How do traders distinguish variance from genuine system failure?
Statistically, 60–70% of losing trades are expected variance, not failure. That single fact should change how you react to a losing streak. The brain stops trading the chart and starts trading the pain, and that is exactly when bad decisions get made.
A four-signal diagnostic checklist helps you stay objective:
- Check drawdown depth. Is your current drawdown within the 90th percentile of your historical data? If yes, variance is the likely cause. If it exceeds the 95th percentile, you have a structural signal worth investigating.
- Check market regime. Has the volatility profile, trend behavior, or liquidity of your market changed significantly? A regime shift can invalidate a system without the system itself being broken.
- Check loss pattern. Are your losses the same size as historical losses, or are they larger and more frequent? New failure patterns, not just more losses, indicate structural problems.
- Run an execution audit. Review your entry, exit, and sizing compliance. Compliance above 85% on your rules points toward system failure. Compliance below 70% means you are the problem, not the strategy.
Distinguishing variance from structural failure requires all four signals, not just one. Traders who skip the execution audit almost always misdiagnose the problem. They change the strategy when they should fix their own behavior.
Pro Tip: Keep a trade log with a “compliance” column for every trade. Mark yes or no for each rule followed. Review it before you touch your strategy settings.
What are the common failure modes in trading setups?
Five failure modes explain nearly every losing setup: variance, execution timing miss, context invalidation, criteria drift, and regime mismatch. Knowing which one caused a loss tells you what to fix.
The typical distribution across a large sample looks like this:
| Failure mode | Typical share of losses | Corrective action |
|---|---|---|
| Variance | 60–70% | No action needed |
| Execution timing miss | 10–15% | Refine entry process |
| Context invalidation | 5–10% | Tighten setup filters |
| Criteria drift | 5–15% | Audit rule compliance |
| Regime mismatch | 5–10% | Reduce size or pause |
The most dangerous failure mode is criteria drift. This happens when you gradually loosen your entry rules without realizing it. The setup looks similar to your original criteria, but the edge is gone. Aggressive categorization of losses by diagnostic type should always come before any strategy modification.
Impact analysis is the most underused tool for setup evaluation. You compare your actual equity curve against a hypothetical curve that excludes your worst-performing setups. Removing one or two worst setups identified this way can improve P&L by 30–80% and reduce max drawdown by 30–50%. Those are not small numbers.
The psychological side of cutting setups is real. You built those setups. You believe in them. Cutting them feels like admitting failure. But impact analysis reveals hidden leverage points that no amount of emotional attachment can override. Give yourself a defined adjustment period after cutting a setup, and track your execution discipline closely during that window.
For a deeper look at how profitable strategies are structured, understanding what a working system looks like makes it much easier to spot one that is not.
How do you monitor system health before the equity curve breaks down?
The equity curve is a lagging indicator. Overreliance on it delays recognition of decay by 6–18 months. By the time your account balance tells you something is wrong, the damage is already done.
The metrics that give you earlier signals are:
- Rolling expectancy: Calculate this every 20–30 trades. A downward trend across three consecutive windows is a warning sign.
- Average win and average loss: If your average win is shrinking while your average loss holds steady, your edge is eroding.
- Maximum Favorable Excursion (MFE): This measures how far a trade moves in your favor before closing. Monitoring MFE and MAE distributions gives early signals of declining edge before P&L deteriorates.
- Trade frequency: A sudden drop in qualifying setups often signals regime mismatch. The market has changed, and your system is finding fewer valid entries.
- Maximum Adverse Excursion (MAE): If trades are moving further against you before recovering, your entries are degrading even if your win rate looks stable.
A win rate that stays flat while expectancy falls is one of the clearest early warning signs. It means you are winning the same number of trades but making less on each winner. That pattern points directly to trend exhaustion or alpha crowding in your setup.
Trading systems produce measurable signal degradation months before P&L collapses. The traders who catch it early are the ones monitoring internal metrics, not just their account balance.
Set hard kill triggers before you deploy a system. Decide in advance at what drawdown level you reduce size, at what level you pause, and at what level you shut down. Drawdown triggers should be set at deployment and followed without discretionary override. Changing the rules mid-drawdown is how small problems become account-ending ones.
For a structured approach to reviewing trading performance, systematic evaluation methods make these monitoring habits much easier to build and maintain.
Key Takeaways
Recognizing an ineffective trading system requires objective metrics, a minimum sample of 200 trades, and a structured diagnostic process that separates execution errors from genuine strategy failure.
| Point | Details |
|---|---|
| Sample size matters | Evaluate systems on at least 200 trades before drawing any conclusions about failure. |
| Profit factor is a hard signal | Cut any setup with a profit factor below 0.5 immediately; investigate anything below 1.1. |
| Audit execution first | Check compliance rates before changing strategy; below 70% compliance means the trader is the problem. |
| Monitor internal metrics early | Track rolling expectancy, MFE, and MAE to detect decay months before equity curve damage appears. |
| Categorize losses before acting | Identify which failure mode caused each loss before modifying any strategy criteria. |
What I have learned from watching traders evaluate their systems
The most common mistake I see is not overtrading or poor risk management. It is premature abandonment. A trader runs a strategy for six weeks, hits a rough patch, and scraps it. Then they start over with something new, hit another rough patch, and scrap that too. The cycle repeats until the account is gone and the trader blames the market.
The 200-trade commitment is not just a statistical requirement. It is a psychological discipline. When you commit to running a full sample before making any judgment, you stop reacting to individual losses. You start seeing patterns. That shift in perspective is where real improvement begins.
Execution audits changed how I think about system evaluation entirely. Before I ran my first honest audit, I assumed my losses were the strategy’s fault. The audit showed me that a meaningful portion of my worst trades came from entries I took outside my defined criteria. I was the variable, not the system. That realization is uncomfortable, but it is also where the real edge comes from.
Cutting setups is the hardest part. You will feel like you are giving up on something that “almost works.” But almost working is not working. Data does not care about your attachment to a setup. Run the impact analysis, see the numbers, and make the call. The traders who do this consistently are the ones who separate themselves from the 97% who never figure out why their systems keep failing.
— Gabriel
How Tradergibkey supports systematic trading system evaluation
Knowing what to look for is only half the work. Having a structured process to apply it consistently is what actually protects your capital.

Tradergibkey’s resources are built around exactly this kind of disciplined, data-driven evaluation. With over 18 years of live market experience, Tradergibkey teaches traders how to run proper diagnostic audits, analyze setup performance, and build the execution habits that keep a system running at its best. Whether you are trying to assess a current strategy or build a new one on solid ground, the Tradergibkey trading resources give you the frameworks to do it without guesswork or emotional decision-making. The goal is not just to find what is broken. It is to build the evaluation discipline that stops problems before they start.
FAQ
How many trades do I need before evaluating a system?
The industry standard is a minimum of 200 trades. Evaluating a system below 100 trades risks confusing normal variance with structural failure.
What profit factor signals an ineffective trading system?
A profit factor below 0.5 is an immediate cut signal. Anything between 0.5 and 0.7 over 40 or more trades is a strong candidate for removal.
Should I change my strategy during a losing streak?
Run a full execution audit and check your drawdown percentile before changing anything. Most losing streaks are variance, not system failure, and premature changes destroy edge over time.