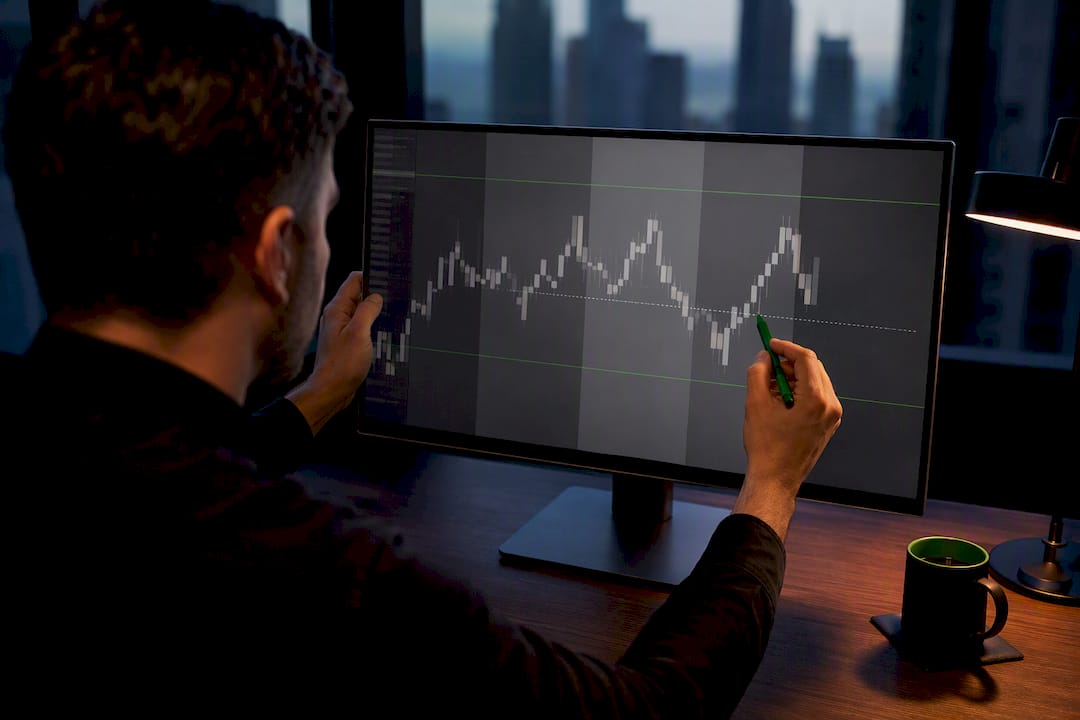
Trade the London-New York overlap with an institutional price-action workflow: set your higher-timeframe bias, mark the visible liquidity pools, wait for a sweep with real displacement, then enter on the retrace. Run this on EUR/USD, GBP/USD, and USD/JPY inside the AM kill zone (roughly 8:30 to 11:00 AM ET) or the PM window (1:30 to 4:00 PM ET). One key rule in the plan is to close out intraday risk before the New York close and to avoid entering new trades immediately before or during major US data releases, since initial spikes often produce false signals.
TL;DR:
- The best times to trade during the New York session are the London-New York overlap and the AM kill zone, with the former offering the most liquidity and potential for breakout moves.
- Successful entries depend on spotting liquidity sweeps combined with strong displacement candles, followed by entries on retraces into order blocks or fair value gaps.
- Market structure, especially higher highs and lows, is more reliable during fast-moving New York hours than traditional chart patterns, which often produce noise.
- Position sizing should be based on volatility measures like ATR and adjusted for spread widening around news rather than fixed pip stops.
- Emotional discipline is critical, with common pitfalls including chasing first moves, revenge trading after losses, and overholding trades into low-volume periods.
Table of Contents
- What Makes the New York Trading Session Different?
- How Do Order Blocks, Fair Value Gaps, and Liquidity Sweeps Work Together?
- What Does a Complete New York Session Trading Routine Look Like?
- Overlap Breakouts and Liquidity Sweeps: The Exact Rules to Trade Them
- How Should You Size Positions During New York Session Volatility?
- This playbook did not come from a backtest. It came from watching the New York session live for many years, refining a checklist that survives contact with real spreads, real slippage, and real hesitation. The routine above is built around one habit: mark your levels before the open, then wait. A pre-market checklist every morning, London high and low, previous day levels, red news flagged, and a short watchlist of two or three pairs, helps prepare before touching a single chart in the AM kill zone.
- How Do Geopolitical Events and the US Calendar Change New York Session Risk?
- How Does New York Session Volatility Compare to London and Asia?
- Which Chart Tools Actually Suit New York Session Trading?
- Why Do Traders Struggle Psychologically During the New York Session?
- Who Is Actually Trading Against You During New York Hours?
- Choosing Between Live New York Trading and a Mechanical Approach
- Master the New York Session
- Further Reading and Primary Sources
- Sources
- FAQ
What Makes the New York Trading Session Different?
The London to New York overlap, roughly 8:00 AM to 12:00 PM ET, is the most liquid stretch of the entire forex day. Both major desks are active at once, which tightens spreads on USD majors and gives breakouts room to actually run instead of stalling out. That is the window to prioritize if you only have one hour to watch charts.
Inside that broader window sits the New York “kill zone,” split into two distinct sessions:
- AM kill zone (roughly 8:30 to 11:00 AM ET): typically produces the day’s largest directional move, and it contains short algorithmic bursts, sometimes called macros, where price pushes cleanly in one direction for a few minutes at a time.
- PM window (roughly 1:30 to 4:00 PM ET): carries less raw volatility but reacts sharply to scheduled US data and the 9:30 AM ET equity open’s lingering effects.
Scheduled US data releases and the equity open reshape volatility fast. The first tick after a release is often noise. Wait for the market to show its hand before committing size.
How Do Order Blocks, Fair Value Gaps, and Liquidity Sweeps Work Together?
Three terms get thrown around a lot in Smart Money Concepts circles, and traders often use them without really knowing what separates one from another. Here is the plain version.
An order block is the last candle or cluster of candles before a sharp directional move, marking where a large player likely built a position. A fair value gap (FVG) is a price imbalance left behind when candles move so fast they skip over a range without trading it twice, and price often returns to “fill” that gap later. A liquidity pool is the cluster of stop orders sitting above old highs or below old lows, resting bait for a sweep.
The execution sequence that ties these together:
- Set your higher timeframe bias first (4 hour or daily direction).
- Mark the nearest liquidity pools above and below current price.
- Wait for price to sweep one of those pools, tagging the stops.
- Require displacement: a strong, decisive candle showing structure actually broke, not just a wick poke.
- Enter on the retrace into the fresh order block or FVG left behind by that displacement.
A sweep by itself is only a probe. Displacement is what turns a probe into a real signal, and skipping that confirmation is the single most common way traders get faked out during the New York session.
Pro Tip: If the candle after the sweep closes back inside the previous range instead of breaking cleanly away from it, that is a rejection, not displacement. Stand down and wait for the next setup.
What Does a Complete New York Session Trading Routine Look Like?
A repeatable routine beats a brilliant one you only run half the time. Build your pre-market checklist the same way every day:
- Mark your higher timeframe bias before the session opens.
- Note the London session’s high and low.
- Log the previous day’s high, low, and close.
- Check the economic calendar for red-flag US data releases.
- Shortlist your pairs. EUR/USD, GBP/USD, and USD/JPY cover most of the session’s best liquidity.
During the AM kill zone, watch the first two macros closely. These are the short windows, often five to twenty minutes long, where institutional flow shows its hand. If price sweeps a marked pool and displaces cleanly within that window, you have a trade. If the first ninety minutes produce nothing but chop, that is data worth respecting: skip the session rather than force an entry.
The PM window calls for a different posture. Size down, since volatility usually eases once the London close has passed, and range-based approaches at support and resistance extremes tend to outperform breakout chasing. Close out intraday risk before liquidity thins toward the end of the New York day.
Overlap Breakouts and Liquidity Sweeps: The Exact Rules to Trade Them
Two setups do most of the work during the New York session. Learn to run each one the same way every time.
Overlap breakout checklist:
- Mark the level, an Asian range high or a clear London consolidation edge.
- Wait for a confirmation candle that closes beyond the level, not just wicks through it.
- Place your stop just beyond the opposite side of the breakout candle.
- Target the next liquidity pool or a fixed multiple of your risk.
Sweep and reclaim checklist:
- Select an obvious level, an old high, an old low, or a session extreme everyone can see.
- Wait for price to sweep it, then reclaim the level with a strong close back on the correct side.
- Enter on the retrace into the FVG or order block that displacement created.
- Set your stop beyond the sweep’s extreme, not just beyond your entry candle.
News and equity-open handling deserve their own rule set. Avoid the first reaction to any major release; the initial spike is often reversed within minutes. Wait for a retest, typically thirty to sixty minutes out, before trading the follow-through. Around the 9:30 AM ET equity open, tighten stops or scale out of existing positions rather than adding new risk. Equity opens frequently act as a second catalyst that can reverse whatever the earlier NY move suggested.
Pro Tip: Keep a simple line on your chart for the prior day’s close. Price behavior around that line right after the equity open tells you more about real conviction than the first five minutes of the release itself.
How Should You Size Positions During New York Session Volatility?
Fixed pip stops make no sense in a session where volatility swings hour to hour. Size your position against a volatility measure like the Average True Range (ATR) instead, so a 15 pip stop on a quiet Tuesday and a 35 pip stop on a Non Farm Payrolls Friday carry the same actual risk.
Spreads widen fast around news. Build in rules for when to step back entirely:
- Skip the trade if spread widens beyond your normal tolerance right before entry.
- Widen your stop rather than tighten it during confirmed high volatility windows, since a tight stop just gets clipped by noise.
- Scale out partial size at your first target and let the remainder run with a trailing stop.
- Flatten remaining intraday risk into the New York close rather than holding it into the low liquidity overnight hours.
Journal every session the same day you trade it. A written record of entries, stops, and outcomes is what turns a string of trades into an actual improving process instead of a blur of guesses.
This playbook did not come from a backtest. It came from watching the New York session live for many years, refining a checklist that survives contact with real spreads, real slippage, and real hesitation. The routine above is built around one habit: mark your levels before the open, then wait. A pre-market checklist every morning, London high and low, previous day levels, red news flagged, and a short watchlist of two or three pairs, helps prepare before touching a single chart in the AM kill zone.
For traders who want the guided version of this, with live trade reviews and a community checking your work, the structured breakout framework is a natural next step after mastering the basics above.
How Do Geopolitical Events and the US Calendar Change New York Session Risk?
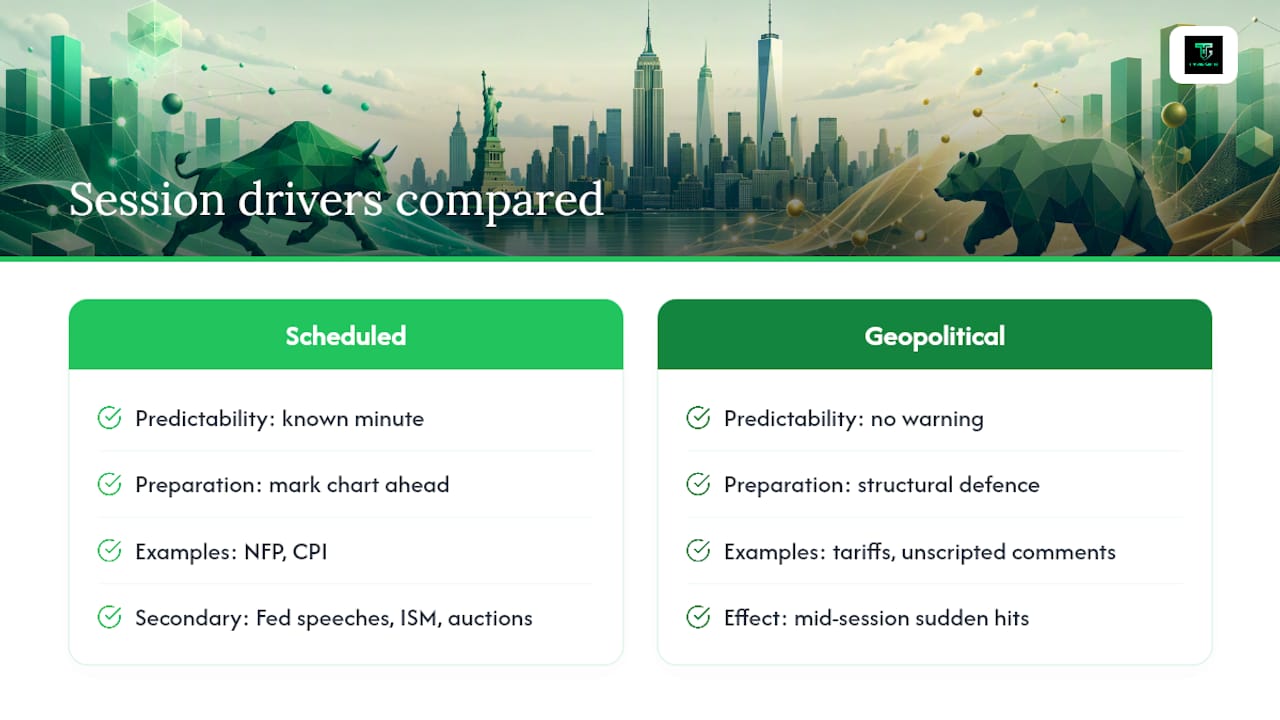
Scheduled data gets most of the attention, but geopolitical headlines move the New York session just as hard, and with far less warning. A surprise tariff announcement, a central bank official’s unscripted comment, or a sudden escalation overseas can hit USD pairs mid-session with none of the lead time a calendar entry gives you.
The practical difference is preparation time. You can mark your chart ahead of a Consumer Price Index release because you know the exact minute it lands. A geopolitical shock offers no such courtesy, which means your defense has to be structural rather than predictive. Keep stops honest at all times rather than loosening them on quiet days, because the quiet days are exactly when an unscheduled headline does the most damage to an oversized position.
Beyond the marquee releases, the US calendar carries a second tier worth tracking: Federal Reserve speeches, Treasury auction results, and mid-tier reports like the ISM Manufacturing Index. None of these move price the way Non Farm Payrolls does, but they can trigger the kind of choppy, directionless price action that chews through stops without ever displacing structure. Cross-referencing your entry against the calendar, even for these secondary events, prevents you from mistaking calendar-driven noise for a genuine liquidity sweep.
Treat any session with unresolved geopolitical tension as a reduced-size session by default. The setups still form. The follow-through just gets less reliable, and reliable follow-through is the entire point of waiting for displacement before you enter.
How Does New York Session Volatility Compare to London and Asia?
Each session has a personality, and trading all three the same way is a fast route to frustration. The Asian session, running roughly 7:00 PM to 4:00 AM ET, is the quietest of the three: tight ranges, low volume outside of Japanese and Australian data, and a market that mostly consolidates rather than trends. Range strategies fit Asia far better than breakout hunting does.
London, opening around 3:00 AM ET, brings the first real volume of the day and often sets the high or low that New York later sweeps. The London-New York overlap is where these two personalities collide, and that collision is precisely what produces the session’s best liquidity and cleanest breakouts.
New York on its own, once London has closed for the day, settles into something closer to London’s opening hours but with US data as the wildcard. The AM kill zone typically produces more raw movement per hour than any stretch of the Asian session and rivals London’s own open. The PM window, by contrast, often moves less than London’s afternoon does, since a chunk of the day’s institutional flow has already been spent.
The strategic takeaway: match your approach to the session’s actual character instead of running one static system everywhere. Breakout and sweep tactics suit the overlap and the AM kill zone. Range tactics suit the PM window and most of the Asian session. Trading a range strategy during the overlap, or a breakout strategy during a dead Asian range, is fighting the session instead of using it.
Which Chart Tools Actually Suit New York Session Trading?
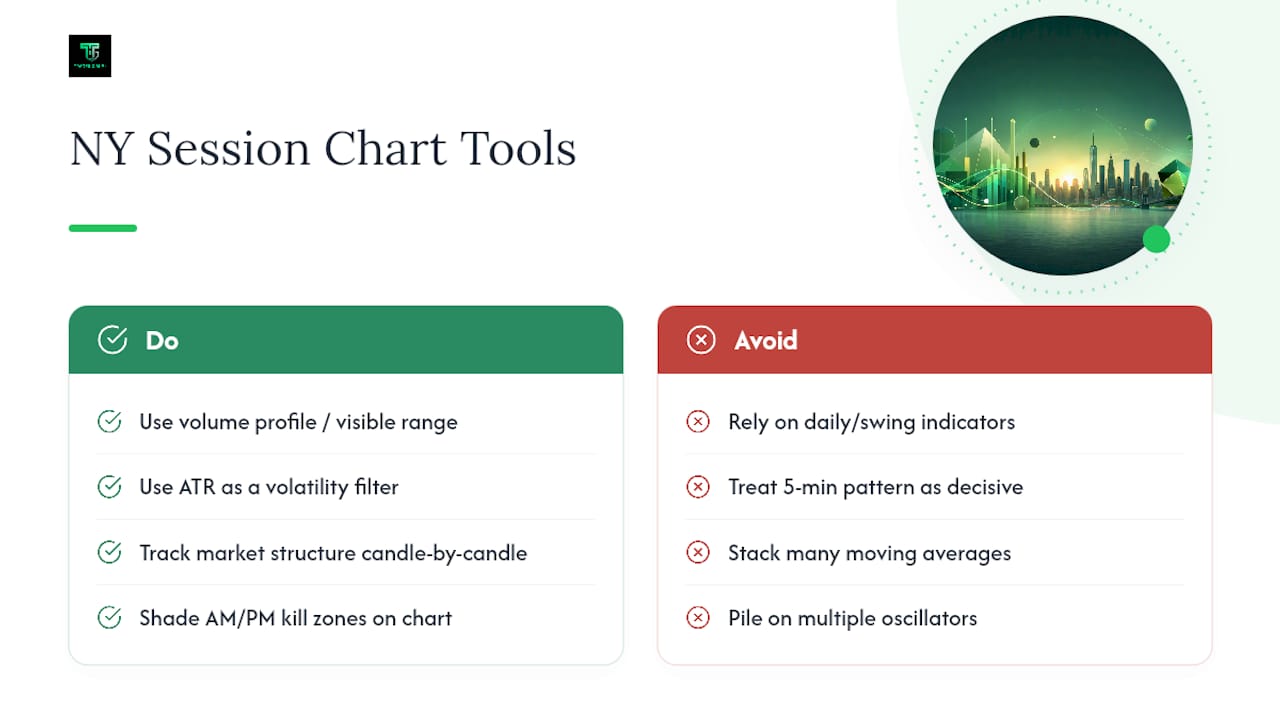
Most indicator advice out there is generic, built for daily charts and swing positions, and it falls apart on the five and fifteen minute charts where New York session decisions actually get made. A handful of tools earn their place here.
Volume profile, or a simple visible range tool, shows you exactly where prior session volume clustered, which is a faster way to spot a liquidity pool than eyeballing swing highs alone. ATR, mentioned earlier for position sizing, doubles as a volatility filter: if ATR compresses hard heading into the AM kill zone, expect a slower, choppier open than usual.
Chart patterns matter less here than clean market structure. A textbook head and shoulders pattern on a 5 minute chart during New York hours is frequently just noise dressed up as a pattern, because the session’s speed overwrites slower technical formations before they finish. What actually holds up is structure: higher highs and higher lows, or the reverse, tracked candle by candle through the kill zone.
Session-based indicators that shade the AM and PM kill zones directly on your chart remove the guesswork of checking a clock against a time zone converter mid trade. Combine that visual with a simple horizontal line tool for marking the previous day’s high, low, and close, and you have most of what a New York session chart actually needs. Anything beyond that, a dozen overlapping moving averages, five oscillators stacked on top of each other, tends to slow down decisions rather than sharpen them during a session that moves this fast.
Why Do Traders Struggle Psychologically During the New York Session?
The New York session’s speed is exactly what trips people up. Decisions that would take a full afternoon on a quiet Asian range have to happen in the space of a single five minute candle here, and that compressed timeline invites a specific kind of pressure most traders underestimate until they feel it.
The most common pitfall is chasing the first move without waiting for displacement, because the fear of missing a fast breakout overrides the checklist. The fix is mechanical: no entry without a confirmed close beyond the level, full stop. A second, quieter pitfall is what happens after a stopped-out trade during the AM kill zone. The brain stops trading the chart and starts trading the pain, hunting for a way to get the loss back inside the same session instead of waiting for the next valid setup. That is a revenge trade, and the New York session’s volatility makes revenge trades unusually expensive because the next candle can move just as far against you as the first one did.
A third trap is overstaying a winning trade into the lunch lull, roughly 12:00 to 1:00 PM ET, when volume drops and a position that looked strong at 11:45 AM can drift sideways or reverse simply because the volume that was pushing it has left the market. None of these pitfalls are exotic. They are the same three mistakes repeated in slightly different clothing, and a written rule set, checked before you enter rather than after you lose, is still the most reliable defense against all three.
Who Is Actually Trading Against You During New York Hours?
Understanding who else is on the other side of your trade changes how you read the tape. Institutional desks, banks and large funds, dominate the AM kill zone, and their orders are large enough to create the sweeps and displacement this entire strategy is built around. They are not trying to catch a five pip scalp; they are moving size, and that size is what leaves footprints like liquidity sweeps and fair value gaps behind.
Retail traders cluster their stop orders at obvious levels, prior highs, prior lows, and round numbers, which is precisely why those levels get swept before the real move starts. Algorithmic systems add another layer, executing the short bursts inside each kill zone that create the “macro” pushes worth watching for. US-based day traders and equity desk activity layer on top of all this once the 9:30 AM ET stock market open hits, often intensifying whatever move started earlier in the kill zone or reversing it outright.
Knowing this hierarchy is why the sweep and displacement sequence works better than blind breakout chasing. You are not guessing at direction. You are waiting for the largest, most consistent participants to reveal their hand before committing your own capital behind them.
Choosing Between Live New York Trading and a Mechanical Approach
Live New York trading rewards traders who can actually watch the overlap and the AM kill zone in real time, and who have the discipline to skip a session that is not showing displacement. If your schedule cannot reliably cover 8:00 AM to noon ET, a London-focused or systematic approach may fit your life better than forcing New York hours you cannot consistently watch. The honest rule of thumb: time available multiplied by discipline determines whether live New York setups belong in your plan, or whether a slower, rule-based system serves you better.
— Gabriel
Master the New York Session
Reading a checklist is one thing. Running it live, under real pressure, with someone checking your entries before the account takes the hit, is another. Structured courses built around the exact price-action and institutional sequence covered above, live trading walkthroughs during the actual AM and PM kill zones, and direct mentorship are available for traders wanting that second version.

Members get daily market analysis, trade checklist templates, live trade reviews, and ongoing support when a setup does not go the way the textbook says it should. Support and community interaction help catch habits a solo trader might miss. If the workflow in this guide made sense to you, the next step is straightforward: visit Trader Gibkey and see which course or mentorship track matches where you are right now.
Further Reading and Primary Sources
The rules in this guide draw on session-timing research and institutional trading frameworks.
- IG Academy’s breakdown of New York session trading for overlap mechanics.
- The New York kill zone AM/PM framework for macro timing.
- KenMacro’s New York open playbook for data-day execution.
- Day trading breakout types from Tickerly for broader breakout context.
This article is general information, not a substitute for advice from a qualified financial advisor. Consult a qualified financial professional about your own circumstances before acting on anything here.
Sources
- Trading the New York session - IG
- New York Kill Zone: How to Trade AM and PM Windows
- New York Open Trading Strategy 2026: US Session Playbook | KenMacro
FAQ
Is it possible to make $1,000 a day in forex?
It is possible on a large enough account with disciplined risk management, but it is not realistic or sustainable as a fixed daily target for most account sizes, since it usually demands risking more than sound position sizing allows.
What is the 5-3-1 rule in forex?
It is a simplicity guideline: master 5 currency pairs at most, refine them down to 3 strategies you actually understand, and trade with 1 consistent, repeatable plan rather than switching systems constantly.