
An opening range breakout uses the high and low printed in the first few minutes of the session to trigger a trade when price closes beyond either level. Start with a 15-minute range, wait for a full candle close beyond the high or low, and confirm the move with above-average volume and a VWAP that agrees with your direction. Realistic win rates run 40 to 60 percent, so the strategy lives or dies on reward-to-risk, not on being right most of the time.
TL;DR:
- Valid opening ranges often show confirmed two-sided trading within a proportional size relative to the stock’s average true range, avoiding narrow or gapping ranges.
- Using a 15-minute window balances trade frequency with conviction, with longer or shorter frames suited to specific volatility and trader availability.
- Entering only on a candle close beyond the range and confirming with volume and VWAP alignment significantly reduces false breakouts.
- Stops are best placed at the opposite range side or using a tighter breakout-bar or VWAP-based trail, with position size based on a defined 1R risk amount.
- Expect win rates around 40 to 60 percent, emphasizing reward-to-risk and expectancy over accuracy, with thorough backtesting and filtering crucial for success.
Table of Contents
- What Is the Opening Range Breakout?
- Timeframe Variants: 5, 15, and 30 Minutes
- How Do You Enter, Set Stops, and Size an ORB Trade?
- What Filters Reduce False Breakouts?
- Why Do Opening Range Breakouts Fail?
- How Reliable Is the Opening Range Breakout Strategy?
- A Step-by-Step 15-Minute ORB Walkthrough
- Trader Gibkey’s Practitioner Notes on Trading ORB
- When Does Opening Range Breakout Actually Fit Your Trading Plan?
- Ready to Trade ORB With a Structured System?
- Sources
What Is the Opening Range Breakout?
The opening range is simply the high and low printed during the market’s opening minutes. Traders mark the top as the ORH (opening range high) and the bottom as the ORL (opening range low), then treat those two lines as a battlefield. When price closes outside either boundary, it signals that one side won the early fight for control, and that a breakout strategy has a real shot at follow-through.
The open matters because it concentrates more conviction, more order flow, and more information than almost any other stretch of the trading day. Overnight news, pre-market positioning, and the first wave of institutional orders all collide in those opening minutes. That collision produces a range that tends to mean something, unlike the low-volume drift you often see at midday.
Drawing the range is mechanical. Pick your window (5, 15, or 30 minutes), note the highest high and lowest low printed inside it, and draw two horizontal lines. That’s your opening range for the session.
Not every range is worth trading, though. Here’s what separates a valid “lid” from noise:
- A valid range shows real two-sided trading, with price testing both edges at least once before settling.
- A valid range is proportional to the stock’s average true range, not a tiny sliver that any random tick can shatter.
- A non-range happens when the stock gaps and barely moves, leaving a range so narrow that normal volatility guarantees a false break.
- A non-range also shows up on days with no clear high-volume push, just chop drifting sideways with no conviction either way.
Getting this distinction right before you ever place a trade is what separates a disciplined opening range strategy from a coin flip.
Timeframe Variants: 5, 15, and 30 Minutes
Picking your window is the first real decision in any opening range strategy, and it changes everything downstream, from trade frequency to how much conviction you need before pulling the trigger.
- The 5-minute window produces the most signals and the fastest entries, but it also catches more noise. This is the domain of the 3-candle rule, a popular variant that requires a minimum of three candles to form a clean lid on the 5-minute chart before you even consider the breakout valid. Skipping that patience step is the fastest way to get chopped up on a range that never finished forming.
- The 15-minute window is the widely used middle ground, balancing enough trade frequency with enough conviction to filter out the worst noise. This is where most traders start, and it’s the default reference point throughout this guide.
- The 30-minute window trades less often but tends to produce cleaner signals, since it filters out the earliest, choppiest ticks of the session. Better suited to traders who can’t watch every 5-minute candle print.
Beyond the timeframe choice, a few setup variants are worth knowing:
Gap and go applies to stocks that open with a significant gap from the prior close; the opening range then acts as a continuation trigger rather than a reversal signal. Retest entries wait for price to break the range, then pull back to retest the broken level before entering, trading fewer signals for tighter stops and better reward-to-risk. The 1-minute variant exists for scalpers working extremely liquid names, but the noise-to-signal ratio gets punishing fast, and most traders are better served sticking with 5 or 15 minutes until they’ve proven an edge.
None of these variants is inherently superior. They’re tools for different symbols, different account sizes, and different amounts of screen time. A trader watching one chart all morning can afford the 5-minute window’s frequency; a trader juggling five positions probably can’t.
How Do You Enter, Set Stops, and Size an ORB Trade?
Enter only on a confirmed candle close beyond the opening range, never on a wick. A candle can spike through the ORH and slam back inside the range within seconds, and that wick means nothing without a close to back it up. Waiting for the close costs you a few ticks of entry price. It saves you from the single most common way ORB traders lose money.
Stop placement has three common approaches, and each trades off risk against how often you get stopped out on noise:
- Opposite side of the range is the default: if you’re long above the ORH, your stop sits at the ORL. Simple, mechanical, easy to backtest.
- Mid-range stop tightens your risk by placing the stop halfway through the range instead of at the far edge, useful on wider ranges where the full width would eat too much of your account.
- Breakout-bar low or high uses the low (for longs) or high (for shorts) of the actual candle that triggered your entry, which tends to be tighter than the full range but requires the breakout bar itself to be well formed.
- VWAP-based stops work as a trailing mechanism once you’re in profit, since a close back through VWAP often signals the trend day thesis has failed.
Position sizing starts with defining your 1R, which is simply the dollar or pip distance between your entry and your stop. Risk a fixed percentage of your account on that 1R, and every subsequent target becomes a multiple of it. A common mechanical rule set targets 1.5x to 2x the range height for a first partial exit, then trails the remainder for trend days where the range can run several R multiples.
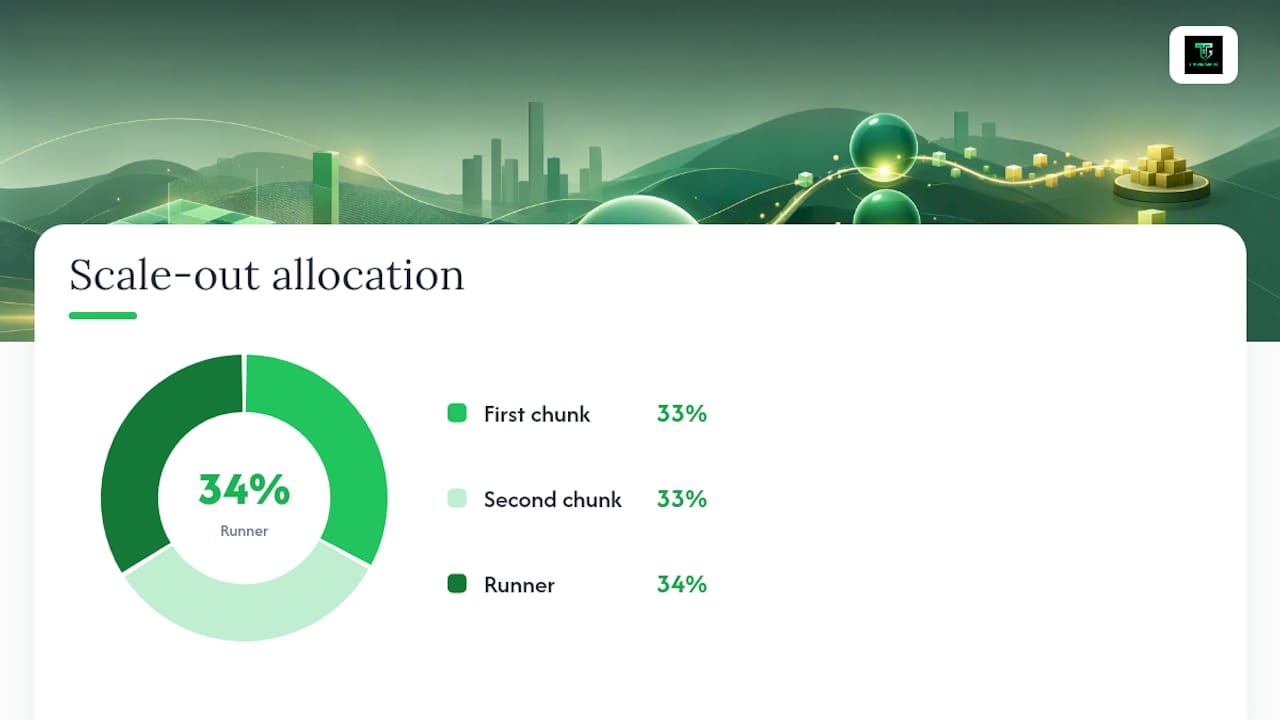
Pro Tip: Scale out in thirds. Take partial profit at 1R to cover your risk, another chunk at your primary target, and let a small runner ride with a trailing stop for the days that turn into real trend moves.
Build a time stop into every trade, too. If price hasn’t moved meaningfully in your favor within a set number of bars, the setup has failed even if your price stop hasn’t been hit yet. Sizing rules deserve their own deeper study; Tradergibkey’s risk management guidance walks through the math in more detail.
What Filters Reduce False Breakouts?
Volume and VWAP alignment are the two filters that matter most. A breakout without volume behind it is a suggestion, not a signal, and professional traders commonly wait for the breakout bar to print two to three times the average five-minute volume of the preceding hour before trusting it.
VWAP tells you which side of the day’s average price the crowd is actually paying. A long breakout above the ORH with price also above VWAP has the wind at its back. The same breakout below VWAP means you’re buying into resistance the rest of the market is fighting against.
Beyond those two, a handful of secondary filters separate high-quality setups from traps:
- Relative strength compares the stock to its sector or the broader index; a breakout that’s outperforming SPY has more conviction than one that’s merely drifting with it.
- Index confirmation checks whether the S&P or Nasdaq is trending in the same direction as your trade, since fighting the tape rarely pays.
- Day-type filters flag conditions to avoid entirely, including narrow ranges relative to average true range, choppy pre-market action, or scheduled news landing inside your opening window.
Volume confirmation and VWAP alignment materially reduce false-breakout rates, and combining even two of these filters cuts a meaningful share of the low-quality setups that would otherwise stop you out. Sitting out is itself a filter. The best ORB traders skip more setups than they take.
Why Do Opening Range Breakouts Fail?
Fakeouts top the list. Price wicks through the ORH, traps a wave of eager breakout buyers, then reverses hard as the same institutions that pushed the spike use it to unload size. The ChartingLens guide on ORB strategy calls this the “obvious trap,” and it’s exactly why close-over-wick discipline isn’t optional.
A Tradergibkey piece on fakeout patterns covers this dynamic in more depth if you want to study how these traps repeat across different symbols.
Here’s what else sinks ORB trades:
- Trading against index bias means taking a long breakout while the S&P is grinding lower; the setup can look perfect and still fail because the broader tape overrides it.
- News inside the opening window corrupts the range itself, since a scheduled data release or earnings reaction produces a range built on emotion rather than genuine price discovery.
- Overtrading narrow ranges happens when a range is small relative to the stock’s average true range, guaranteeing that ordinary volatility will trigger stops on both sides before a real move develops.
- Ignoring relative range size in general leads traders to force setups on days that simply don’t have the volatility to support a trend move.
Each of these is avoidable with the filters already covered. The traders who blow up on ORB usually aren’t missing information. They’re skipping the filter they already know about because the setup “looks too good to pass up.”
How Reliable Is the Opening Range Breakout Strategy?
Realistic win rates for ORB sit in the 40 to 60 percent range, and that’s the number that trips up most beginners who expect a strategy to be “right” most of the time. ORB isn’t built on accuracy. It’s built on expectancy, meaning the average dollar (or pip) result across all your trades once wins and losses are combined.
The math that matters: a 45% win rate with an average win of 2R and an average loss of 1R still produces positive expectancy, because (0.45 x 2) minus (0.55 x 1) comes out ahead of zero. A 70% win rate with a 1:1 reward-to-risk can lose money if losers run bigger than expected.
Before trusting any version of this strategy with real capital, run it through a backtest checklist:
- Sample size needs to cover at least 100 trades across varied market conditions, not just one hot month.
- Slippage and commissions must be modeled realistically, especially on the 5-minute variant where entries happen fast and spreads widen.
- Intraday spreads matter more for less liquid names, where the bid-ask gap alone can eat a chunk of your 1R.
- Time-of-day filters should be tested explicitly, since the same setup often performs differently in the first hour versus the last.
Track these metrics religiously: win rate, average R per trade, expectancy, maximum drawdown, and trades per month. A strategy that looks great on win rate alone but shows a brutal drawdown curve isn’t one you want to trade live, no matter how clean the entries look on a chart.
A Step-by-Step 15-Minute ORB Walkthrough
Here’s a template you can copy directly into a backtester or a manual morning routine:
- Mark the range. At the 15-minute mark after the open, note the highest high and lowest low. Draw the ORH and ORL.
- Run the confirmation checklist. Check relative volume against the prior hour’s average, confirm price sits on the correct side of VWAP, and glance at the index to make sure you’re not fighting the broader tape.
- Wait for the close. A candle must close beyond the ORH (for longs) or ORL (for shorts). No wick-only entries, ever.
- Enter and set your stop. Place the stop at the opposite side of the range. Calculate your 1R as the distance between entry and stop.
- Set your target. Aim for 1.5x to 2x the range height on the first partial exit, then trail the remainder with a VWAP-based stop for trend days.
- Journal the trade. Record entry time, RVOL at breakout, VWAP relationship, R achieved, and a one-line note on what the setup actually looked like.
Pro Tip: Journal every trade you skip, too, not just the ones you take. The setups you correctly avoid teach you as much about your filters as the ones that hit target.
Trader Gibkey’s Practitioner Notes on Trading ORB
After years of live execution, one lesson stands above the rest: candle-close confirmation and volume beat every early wick entry a trader has ever been tempted by. The setups that look “too perfect” in the first thirty seconds are usually the ones that trap the most volume.
Forex traders adjusting this strategy need a few tweaks, especially when carving profits with breakout trading in Forex by combining ORB with execution tools. Tick volume has to stand in for real volume, since spot Forex doesn’t report centralized volume the way equities do. Session timing also shifts everything: Tradergibkey’s Asian range approach and London-session adjustments treat the opening range as session-specific rather than fixed to a single clock time.
A few behavioral rules keep this strategy sustainable:
- Cap trades per session so a losing streak doesn’t turn into revenge trading.
- Journal every entry, win or lose, with the filter conditions that were present.
- Review a full week of trades with a mentor or peer before adjusting any rule.
Different sessions call for different breakout variants depending on liquidity and time of day.
When Does Opening Range Breakout Actually Fit Your Trading Plan?
ORB earns a spot in your plan when you can watch the first 15 to 30 minutes of the session with full attention. It’s a poor fit for anyone checking charts between meetings. The strategy rewards presence at exactly the moment most traders are least available.
Where it complements other setups is in trend identification. A clean 15-minute ORB read often tells you what kind of day you’re in, and that read carries into afternoon setups even after the morning trade is closed. Pause it on days with major scheduled news sitting inside your window. The range built on that kind of volatility isn’t measuring conviction, it’s measuring confusion.
The learning curve is real, and it’s shorter with structured mentorship than with trial and error alone. Watching someone size, filter, and journal live trades compresses months of guesswork into weeks.
— Gabriel
Ready to Trade ORB With a Structured System?
Some traders provide mentorship with live walkthroughs of filters, stops, and journaling habits covered here, in real time, on real setups. Where most free content stops at “wait for a close beyond the range,” Mentorship can build the RVOL and VWAP filters, the session-timing adjustments for Forex, and the journaling discipline into a repeatable system you practice under guidance instead of guessing alone.

Course access includes structured price-action lessons, live trading sessions where these exact ORB rules get applied to real charts, and journaling templates built around the same R-multiple tracking covered above. If you’re tired of testing rules in isolation with no feedback loop, check the course and mentorship options on the Tradergibkey landing page and see which package fits where you are right now.
This article is general information, not a substitute for advice from a qualified financial advisor. Consult a qualified financial professional about your own circumstances before acting on anything here.
Sources
- Guide to Using the Opening Range in Trading
- Opening Range Breakout (ORB) Strategy: The Complete 2026 Day Trading Guide | ChartingLens
- Opening Range Breakout (ORB): The Mechanical First Setup - TradeOlogy Academy