
A false breakout happens when price briefly pushes through a support or resistance level, then reverses back inside the range without follow-through. The decisive signal is never the initial spike — it’s what the next 1–3 candles do after the breach. If price can’t close and hold beyond the level, you’re looking at a fakeout, not a genuine move.
Three things to act on right now:
- Wait for the close. A wick through a level means nothing without a candle body closing beyond it.
- Check volume. A real break shows sustained volume expansion; a fakeout usually shows a spike then a fade.
- Watch for the retest. After a false break, price often returns to the broken level from the inside — that retest is your higher-probability entry.
Pro Tip: Set your chart to show candle closes, not just price ticks. Most trading platforms default to showing live price, which makes wicks look like breakouts. Switch to close-based alerts so you react to confirmed moves, not noise.
Key Takeaways
False breakout trading is a repeatable edge when you standardize your checks — close, volume, ATR distance — and keep tight risk per trade.
| Point | Details |
|---|---|
| Close beats the wick | A candle closing back inside the range is the only reliable confirmation of a false breakout. |
| Volume is the tie-breaker | A spike then fade on volume signals a stop run, not a genuine breakout. |
| Retest entries are higher probability | Waiting for the level to flip and retest reduces fakeout risk and improves risk-reward. |
| Size to your stop | Risk 0.5–1% per trade; for intraday fakeout plays, cut to 0.25–0.5% to stay in the game. |
| Tradergibkey builds the skill | Structured courses and live mentorship sessions apply these rules to real charts with direct feedback. |
Table of Contents
- What is a false breakout and how does it differ from a true breakout?
- How do you spot a false breakout as it forms?
- Which indicators help you filter real breaks from fakeouts?
- How do you trade false breakouts with clear entry and exit rules?
- Risk management and the mindset that keeps you out of trouble
- Annotated walkthroughs: seeing the rules in action
- Tradergibkey’s 10-step live-trade checklist for false breakouts
- When is false breakout trading worth it, and what should you practice next?
- The lesson that changed how I read every breakout
- Tradergibkey’s courses and mentorship can sharpen your fakeout edge
- Sources
- FAQ
What is a false breakout and how does it differ from a true breakout?
A true breakout closes beyond the level, holds there on the retest, and continues in the breakout direction. A false breakout — also called a fakeout — closes back inside the prior range within a few candles. That distinction sounds simple, but most traders get trapped because they react to the initial move, not the close.
According to FN Trading Lab, the decisive element is what price does across the next 1–3 candles after the breach. A wick-heavy bar with no higher-timeframe close beyond the level is the textbook signature of a fakeout. Larger players often engineer these moves deliberately, pushing price past obvious levels to trigger retail stop orders and collect liquidity before reversing. The tell is a long wick and a body that closes back inside — a liquidity sweep in plain sight.
Common false breakout shapes to recognize:
- Pin bar / rejection wick: Long wick through the level, small body closing back inside. The wick shows the attempt; the body shows the failure.
- Fakey / inside-bar break: Price breaks out of an inside bar, then reverses sharply back through the inside bar’s range.
- Failed retest: Price breaks out, pulls back to the level, and then collapses through it rather than bouncing — the level flips from support to resistance, or vice versa.
False breakouts cluster around specific price zones: round numbers (1.2000 in EUR/USD, $200 in a stock), prior swing highs and lows, and levels that have been tested multiple times. Low-liquidity sessions — particularly the Asian session — produce a disproportionate share of fakeouts because thin order flow makes it easier for price to spike through a level without real conviction behind it.
How do you spot a false breakout as it forms?
Catching a fakeout in real time requires reading several signals together. No single cue is enough on its own, but when two or three align, the probability shifts clearly.
Candle structure
The break bar itself tells you a lot. A genuine breakout bar tends to close near its high (for an upside break) with a relatively small upper wick. A fakeout bar often closes near the middle or back inside the range, leaving a prominent wick beyond the level. Priceaction is direct on this: entering on the wick invites high fakeout risk. Wait for the close or a confirmed retest.
Volume signature
False breakouts often show a big volume spike on the initial break — that’s the stop run — followed by declining volume on any attempt to continue. The reversal then comes with renewed volume as the trapped traders exit and smart money fades the move. Indicator describes this pattern clearly: volume is often the tie-breaker between a real break and a fakeout. Look for sustained expansion, not a single spike.

Multi-timeframe context
A break on a 5-minute chart means far less when the daily chart shows a major resistance zone directly overhead. Always check one or two timeframes higher before deciding a breakout is real. For Traders confirms that false-break frequency is much higher on 1–5 minute charts than on hourly or daily charts. The higher the timeframe, the more reliable the signal.
Pro Tip: The Asian session is the fakeout factory. If you see a level breach between midnight and 7 AM EST, treat it as guilty until proven innocent by the London open.
Which indicators help you filter real breaks from fakeouts?
Indicators work best as confirmation tools, not as primary signals. Price action gives you the setup; indicators tell you whether the conditions support it.
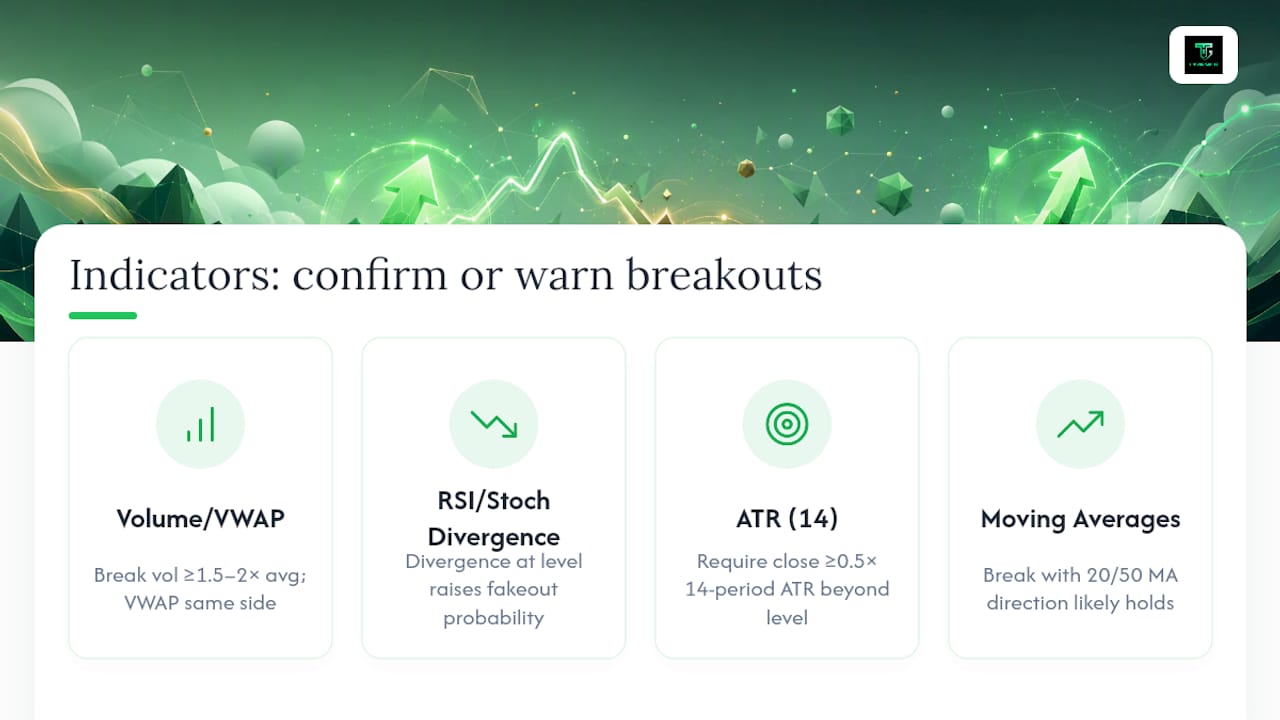
Volume and VWAP
On a genuine breakout, volume should be at least 1.5–2× its 20-period average on the break bar, and VWAP should be on the same side as the break. If price breaks above resistance but stays below VWAP, that’s a warning sign. A fakeout often shows a volume spike that quickly collapses — the spike is the stop run, not real buying or selling pressure.
RSI and Stochastic divergence
Bearish divergence on RSI (price makes a new high, RSI makes a lower high) right at a resistance level is an early warning that the breakout lacks momentum. The same logic applies in reverse for support breaks. Divergence alone doesn’t confirm a fakeout, but paired with a wick-heavy break bar, it raises the probability significantly.
ATR for stop sizing and distance
The 14-period ATR tells you how much the market normally moves in a given period. For Traders recommends requiring a close of at least 0.5× the 14-period ATR beyond the level before treating a break as genuine. If the break distance is smaller than that, the move is within normal noise range — not a confirmed break.
Moving averages for trend context
A breakout in the direction of the 20-period or 50-period moving average is more likely to hold. A breakout against the trend, especially when price is extended far from the MA, is a prime fakeout candidate.
The indicator trap to avoid
Don’t stack five indicators and wait for all of them to agree. That approach produces paralysis and missed entries. Pick two: one volume-based (volume or VWAP) and one momentum-based (RSI or Stochastic). Use them to confirm what price action is already suggesting, not to replace it.
How do you trade false breakouts with clear entry and exit rules?
There are three primary tactics, and each fits a different situation. LuxAlgo and other educators present all three as viable, with success depending on strict entry discipline and risk control.
Tactic 1: Fade the fakeout (counter-trend entry)
This is the most aggressive approach. You enter against the false break as soon as you see rejection.
- Identify a key level (support, resistance, round number, prior swing).
- Wait for price to break the level and then show a rejection candle — a pin bar or a bar that closes back inside the range.
- Enter on the close of that rejection candle (or on a small pullback into the close).
- Place your stop beyond the false extreme — the tip of the wick, plus a small buffer (0.25–0.5× ATR).
- Target the opposite side of the range or the next significant level.
Best fit: Ranging markets, major round numbers, Asian session fakeouts caught at the London open.
Tactic 2: Trade the retest (confirmation entry)
This is the higher-probability approach. You wait for the level to flip and confirm before entering.
- Price breaks a level and then reverses back inside the range (false break confirmed).
- Wait for price to return to the broken level from the inside — now acting as resistance (if it was support) or support (if it was resistance).
- Enter when price shows rejection at that level on the retest.
- Stop goes beyond the retest high or low.
- Target the prior range low or high, or a measured move.
Indicator.trading describes this process precisely: wait for the rejection to close back inside the range, then enter the reversal with a stop beyond the false extreme. This offers defined risk and often a favorable risk-reward ratio.
Tactic 3: Confirmation entry (follow the real break)
Sometimes a fakeout resolves into a genuine breakout in the opposite direction. This tactic trades that continuation.
- Price fakes out above resistance, reverses, and then breaks below the prior support with a strong close.
- Enter on the close of the break bar or on a retest of the broken support (now resistance).
- Stop above the false high.
- Target a measured move equal to the prior range height.
The stop distance drives the position size — never the other way around.
Risk management and the mindset that keeps you out of trouble
False breakout trading is psychologically demanding. You’re often entering against what looks like momentum, and you’ll get stopped out on legitimate breakouts. That’s the deal. The edge comes from consistency, not from being right every time.
Position sizing rules:
- Risk 0.25–0.5% per trade on high-frequency fakeout setups (scalp or intraday).
- Risk up to 1% on daily or 4-hour timeframe fakeout setups where the signal is cleaner.
- Never increase size after a loss. The urge to “make it back” is how fakeout trading turns into account damage. Read more on position sizing and stop rules before going live.
Stop placement:
Place stops beyond the false extreme — the actual tip of the wick — plus a buffer of 0.25–0.5× ATR. This keeps you outside the noise while still defining your risk clearly. A stop placed too close to the entry gets hunted; a stop placed too far removes the edge.
The psychology piece:
When a fakeout stops you out and then reverses in your direction anyway, the brain stops trading the chart and starts trading the pain. That’s the moment revenge trading starts. The hard rule: one stop-out does not change the setup quality of the next trade. Log it, close the screen for five minutes, and come back with fresh eyes.
Journaling is not optional here. After every fakeout trade — win or lose — write down: what was the signal, what did volume do, and did you follow your entry rules exactly? That single habit separates traders who build an edge from those who repeat the same mistakes. For more on avoiding emotional errors, see trading psychology for beginners.
Annotated walkthroughs: seeing the rules in action
Forex example: EUR/USD resistance fakeout
Picture EUR/USD approaching a prior swing high at 1.0950 during the Asian session. Price pushes through to 1.0962, triggering buy-stop orders above the level. The break bar has a long upper wick and closes back at 1.0948 — below the resistance. Volume spikes on the break bar, then drops sharply on the next two candles.
The setup:
- Break bar closes back inside the range (false break confirmed within 1 candle).
- Volume fades immediately after the spike.
- The Asian session context raises fakeout probability.
- RSI shows bearish divergence at the high.
The trade (fade tactic):
- Entry: 1.0948 on the close of the rejection bar.
- Stop: 1.0968 (above the wick tip, plus 0.3× ATR buffer).
- Target: 1.0900 (prior support, roughly 2.4:1 risk-reward).
The wick is the confession. When price can’t hold a new high for even one full candle, the buyers who pushed it there are already trapped — and their exits become your fuel.
US equities example: stock open-range fakeout
A mid-cap stock opens above its prior day’s high of $48.50, spiking to $49.20 in the first five minutes. Volume is heavy on the open but collapses by the second candle. The third candle closes at $48.30 — back below the prior day’s high.
The setup:
- Open-range breakout fails within three candles (classic fakeout window).
- Volume collapses after the initial spike.
- The prior day’s high now acts as resistance on the retest.
The trade (retest tactic):
- Wait for price to rally back to $48.50 and show rejection.
- Entry: $48.45 on the rejection candle close.
- Stop: $49.30 (above the false high).
- Target: $47.20 (prior support, roughly 1.5:1 risk-reward).
Pro Tip: On US equities, the first 5–15 minutes after the open produce the highest concentration of false breakouts. Many experienced traders simply watch during that window and enter only after the open-range fakeout has resolved.
Tradergibkey’s 10-step live-trade checklist for false breakouts
Copy this into your trade journal and run through it before every fakeout entry.
- Identify the level. Is it a prior swing high/low, round number, or tested zone? The more significant, the better.
- Check the higher timeframe. Does the daily or 4-hour chart confirm this level matters?
- Wait for the break. Did price actually push through the level, or just touch it?
- Read the break bar. Did it close back inside the range, or close beyond it?
- Check volume. Did volume spike then fade (fakeout signal) or expand and hold (real break)?
- Confirm with one indicator. RSI divergence, VWAP position, or ATR distance — pick one and check it.
- Choose your tactic. Fade (immediate rejection), retest (wait for level flip), or confirmation (break in opposite direction)?
- Set your stop. Beyond the false extreme plus 0.25–0.5× ATR buffer. No exceptions.
- Size your position. Risk no more than 1% of account (0.5% or less for intraday fakeout plays).
- Define your target. Prior range boundary, next significant level, or a measured move. Know it before you enter.
Post-trade journal prompt: What did volume do on the break bar? Did I follow all 10 steps, or did I skip one? If I was stopped out, was the stop placement correct, or did I place it too tight?
Pair this checklist with a broader look at breakout strategy types to understand where fakeout trading fits within your overall system.
When is false breakout trading worth it, and what should you practice next?
Fakeout trading works best in specific conditions. Outside those conditions, the edge shrinks fast.
When fakeout trading is higher probability:
- Ranging or consolidating markets where levels are well-defined and respected.
- Major round numbers and prior swing highs/lows on the daily or 4-hour chart.
- London and New York sessions (more liquidity, cleaner reversals) after an Asian-session fakeout.
- Instruments with clear volume data: forex majors, S&P 500 futures, large-cap US stocks.
When to avoid it:
- Strong trending markets where breakouts are more likely to hold.
- News events and earnings releases — volatility is too random.
- Thin markets (holidays, pre-market) where fakeouts are noise, not setups.
A four-step practice plan:
- Step 1: Spend two weeks on a demo account identifying fakeout setups without trading them. Just mark the levels and note what happened.
- Step 2: Start trading the retest tactic only — it’s the most forgiving. Log every trade with the 10-step checklist.
- Step 3: After 20 logged trades, review your metrics: win rate, average risk-reward, and how often you followed the checklist. Use this forward-testing guide to structure that review.
- Step 4: Add the fade tactic only after the retest tactic is consistently profitable on demo.
The lesson that changed how I read every breakout
Most traders lose money on false breakouts not because they can’t read the chart, but because they’re in too much of a hurry. They see price push through a level and they’re already clicking buy or sell before the candle closes. The wick looks like momentum. It feels like momentum. But momentum and a close are two different things.
The single habit that changed my approach: I stopped watching the live price bar and started watching only closed candles. The chart looks completely different when you’re only reacting to what’s already confirmed. You miss some moves — accept that. The moves you catch are cleaner, your stops are tighter, and your decision quality goes up across the board.
If you take nothing else from this guide, take that: trade closed candles, not live price.
Tradergibkey’s courses and mentorship can sharpen your fakeout edge
False breakout trading is one of the highest-skill areas in price action — and it’s one of the core competencies Tradergibkey builds in its structured courses and live mentorship sessions. The difference between a trader who gets trapped by fakeouts and one who profits from them usually comes down to two things: a repeatable checklist and live feedback on real trades.

Tradergibkey’s courses cover price action strategy from the ground up, with dedicated modules on fakeout identification, entry rules, and risk control. Live trading sessions let you watch the 10-step checklist applied in real time, on real charts, with real money on the line. Mentorship packages give you direct feedback on your own trades — not generic advice, but a second set of experienced eyes on your specific setups.
If you’re ready to move from reactive to deliberate on false breakouts, start with the Tradergibkey training programs and find the format that fits your schedule and experience level.
Sources
- Breakout vs False Breakout in Forex Trading: Read This Before You Trade Breakouts | FN Trading Lab
- Indicator
- False Breakouts: Why They Happen and How to Trade Them | For Traders
- 5 False Breakout Strategies for Traders | LuxAlgo Blog
This article is general information, not a substitute for advice from a qualified financial advisor. Consult a qualified financial professional about your own circumstances before acting on anything here.
FAQ
What is a false breakout in trading? A false breakout is when price moves through a support or resistance level but fails to close and hold beyond it, reversing back into the prior range within 1–3 candles.
How do you confirm a false breakout? Look for a candle that closes back inside the range after the breach, combined with fading volume on the follow-through bars. A retest of the broken level that fails to hold adds further confirmation.
Is false breakout trading profitable? It can be, when you apply a consistent checklist — close confirmation, volume check, ATR-based stops, and strict position sizing — and focus on higher-timeframe setups where fakeout signals are more reliable.