
Mack’s Price Action Trading (PATs) is a naked-chart day trading method built around trendlines, disciplined second entries, and tight stop placement above or below market structure. It suits intraday traders who want a rules-based system without indicator clutter, backed by an official manual, an active YouTube community, and a companion indicator suite for those who want structure automated rather than eyeballed.
TL;DR:
- PATs relies on trendlines, second entries, and strict stop placement to identify high-probability trades in trending markets, not in range-bound conditions.
- Backtesting at least 50 historical instances per setup and using fixed percentage risk management are essential to validate the method’s edge.
- Use higher timeframe context to avoid counter-trend failures and ensure stops are placed behind structure to prevent oversized losses.
- Adapting PATs to different markets or timeframes requires tuning trade frequency, stop distances, and filters, especially in volatile markets like crypto.
- Consistent practice through structured lessons, journaling, and community feedback helps turn rule knowledge into reliable trading habits.
Table of Contents
- The Philosophy And Chart Setup Behind Mack’s PATs
- Actionable PATs Setups You Can Test This Week
- Tools And Indicators That Support PATs Trading
- Trade Management: Risk, Stops, And Position Sizing
- How To Learn PATs Without Blowing Up Your Account
- Common Mistakes That Undermine Mack’s PATs System
- Real Trade Examples Using Mack’s PAT Approach
- How Mack’s PATs Compares To Other Price Action Methods
- Adapting PATs To Different Markets And Timeframes
- An Educator’s View On Turning PATs Rules Into Repeatable Habits
- Ready To Turn Mack’s PATs Rules Into A Repeatable Skill?
- Sources
The Philosophy And Chart Setup Behind Mack’s PATs
Mack built PATs on one core belief: price and structure tell you everything a moving average or oscillator tries to approximate late. That philosophy puts price action trading at the center of decision-making rather than lagging math applied to it.
A typical PATs chart stays deliberately sparse. One clean intraday chart, usually a 1-minute or 5-minute timeframe for futures or forex, carries the weight of the analysis. A higher-timeframe chart runs alongside it for context on trend direction and major levels, but it never gets cluttered with a stack of studies fighting for screen space.
The signature rules that separate PATs from generic price-action teaching include:
- Trendline emphasis: drawn off swing highs and lows, adjusted as price develops, and treated as the primary reference for entries.
- Second entries: Mack’s core edge, where the first pullback attempt fails and the second attempt at the same level offers a tighter, higher-probability trigger.
- Two-legged pullbacks: a specific pattern of retracement that PATs traders learn to recognize before committing capital.
- Strict stop placement: stops sit behind the structure that invalidates the trade, not at an arbitrary tick count.
The manual and the official PATs materials package these rules into lesson PDFs and live example posts, so a new trader can see the setup called out in real time rather than reconstructed after the fact.
Actionable PATs Setups You Can Test This Week
Mack’s PATs system revolves around four recurring setups. Each one has a checklist you can run against historical charts before ever risking live capital, which matches the broader rules-based approach that price-action educators recommend: pattern, level, trend, and favorable risk-reward, every single time.
- Pullback / second entry: Confirm the higher-timeframe trend, wait for a pullback to a trendline or prior support, let the first touch fail to hold, then enter on the second touch with a stop just beyond the swing that invalidated attempt one. Target the prior swing high or a measured move.
- Breakout: Require a full-bodied close beyond a well-tested level, not just a wick poke. Wait for a retest of that level on lighter volume or a shallow pullback, then enter with a stop back inside the old range. Invalidation is a close back through the breakout level.
- Reversal: Look for a clear break of the prevailing structure (a lower high failing to make a new high, for example), then wait for confirmation, such as a failed retest of the broken level. Place the stop beyond the extreme that formed the reversal point.
- Inside bar expansion: Identify a “mother bar” with a smaller inside bar tucked within its range. Set entry orders just beyond the inside bar’s high and low, and use the mother bar’s opposite extreme as a tight, defined stop.
Pro Tip: Size every one of these setups the same way: risk a fixed percentage of your account, not a fixed dollar amount, so a wide inside-bar stop and a tight second-entry stop both cost you the same slice of capital.
Backtest each checklist against at least 50 historical instances before trading it live. That volume of repetitions is what separates a hunch from a validated edge, a standard risk-based trading protocol that applies just as well to PATs as to any other price-action framework.
Tools And Indicators That Support PATs Trading
Mack’s manual and site remain the primary study source for anyone learning PATs, and most traders start there before adding anything else to the chart.
The PATS Price Action Indicator automates the parts of the analysis that are tedious to do by eye: it can flag structure breaks and mark potential second-entry zones. What it does not do is replace judgment. Reading whether a pullback actually looks like a clean two-legged retracement, or whether volume confirms a breakout, stays discretionary. Newer structure-mapping tools built for TradingView can track break-of-structure and change-of-character events automatically, which clarifies the picture without replacing the trader’s read on it.
Platform-wise, expect availability to vary:
- NinjaTrader users typically find the widest range of PATs-compatible indicator scripts.
- TradingView supports similar structure overlays through community-built scripts, though naming and settings differ from the original PATS indicator.
- Some traders run naked charts entirely and only add an indicator during high-volatility sessions when structure gets harder to read visually.
Keep the chart clean while you’re learning to read structure yourself. Add a supporting indicator later, once you know what it’s confirming.
Trade Management: Risk, Stops, And Position Sizing
PATs setups only work as a business when the risk math behind them is boring and consistent. Cap risk-per-trade at 1% to 2% of account equity, a baseline consistent with standard price-action risk management guidance, and scale up only after a strategy proves itself across dozens of trades, not a handful of lucky ones.
Stops belong behind the structure that invalidates the setup, not at a round number or a comfortable-looking distance. Mack’s guidance on maximum stop size keeps traders from taking marginal setups where the stop has grown too wide relative to the potential reward.
- Aim for a minimum 2R target when the setup allows it; some second-entry trades will offer more.
- Trail stops behind new structure once a trade moves in your favor, rather than leaving the original stop in place the whole way.
- Track win rate, average winner size, average loser size, and maximum drawdown in a trading journal every week, not just at month’s end.
Risk callout: Risking 1% to 2% per trade with stops placed behind structure is the standard baseline price-action educators recommend, and it’s the same math that keeps a string of losers from becoming account-ending.
Good risk management habits matter more to long-term survival than any single setup does.
How To Learn PATs Without Blowing Up Your Account
Learning PATs works best as a staged process, not a weekend cram session.
- Study the manual and annotated examples until you can identify a second-entry setup on a chart without help.
- Write down exact entry and invalidation rules for one setup, then backtest it against 50 or more historical instances, matching the backtesting standard that separates a real edge from a fluke.
- Paper trade for at least 30 days, tracking every trade as if real money were on the line.
- Scale into small live size only after the paper-trading results hold up, then increase size gradually as your journal confirms consistency.
- Keep a journal that calculates win rate, average winner versus average loser, and max drawdown after every session.
Pro Tip: Backtest one setup at a time. Traders who try to validate pullbacks, breakouts, and reversals simultaneously usually end up with muddled data and no clear read on what’s actually working.
This staged path mirrors the broader roadmap that rules-based price-action traders follow: patterns first, explicit rules second, backtesting third, paper trading fourth, live size last.
Common Mistakes That Undermine Mack’s PATs System
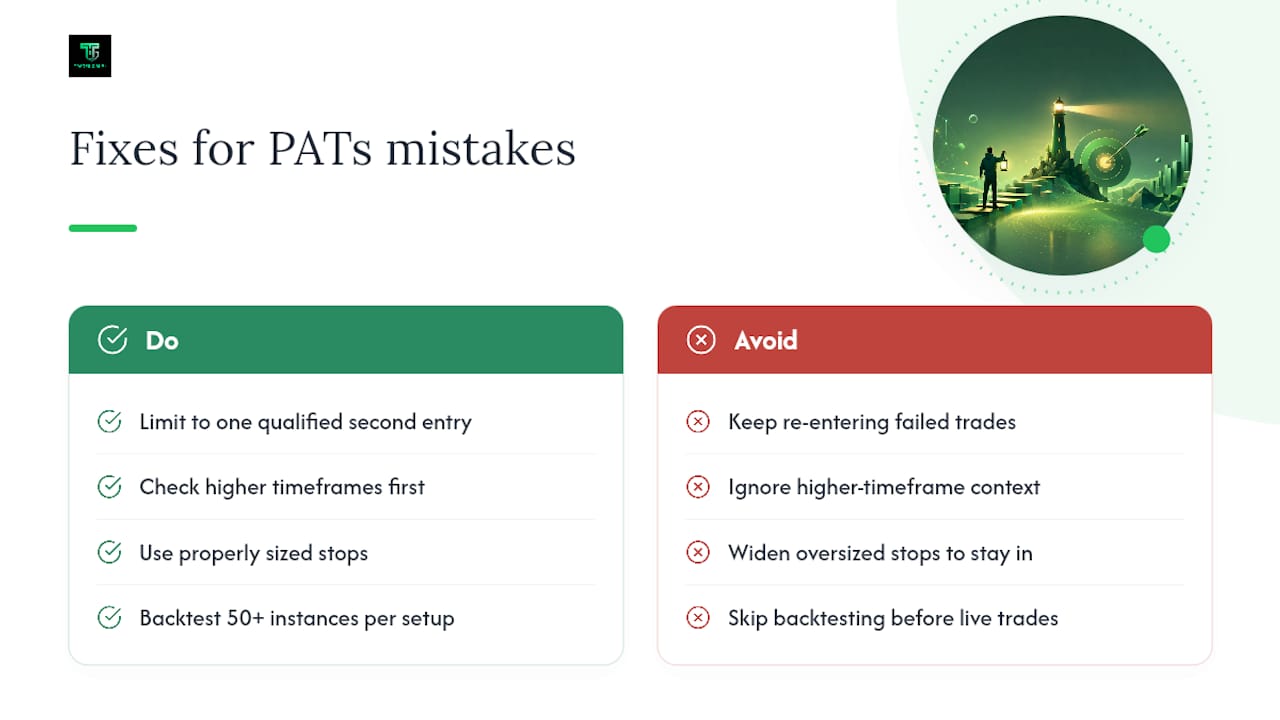
The biggest mistake traders make with PATs is treating the second-entry concept as a license to keep re-entering a failed trade. Mack’s system calls for exactly one qualified second attempt, not an endless series of re-entries every time price dips back to a level. Once the second entry fails too, the setup is dead for that session.
A close second is skipping the higher-timeframe context. PATs traders who only look at the intraday chart end up taking counter-trend second entries that look clean on the small timeframe but fight the dominant move on the daily or four-hour chart. The setup can look textbook and still lose because it’s aimed the wrong direction.
Oversized stops are another recurring problem. When a setup’s natural invalidation point sits too far away, the temptation is to widen the stop rather than skip the trade. That single habit erodes account balances faster than almost anything else in this style of trading, since one wide-stop loser can wipe out several properly sized winners.
Indicator dependence creeps in quietly, too. A trader adds the PATS indicator, starts trusting its structure flags without checking them against the raw chart, and gradually loses the pattern-recognition skill that made the system work in the first place.
Finally, skipping the backtest step and jumping straight to live trading remains the most common shortcut. Fifty-plus historical instances per setup isn’t busywork. It’s the only way to know whether a pattern actually has an edge before your own capital finds out the hard way.
Real Trade Examples Using Mack’s PAT Approach
Picture a trending futures market on the 5-minute chart, price grinding higher against a clean ascending trendline. The first pullback to the trendline gets bought immediately and holds for only a few ticks before rolling over, stopping out early second-entry hopefuls. Price dips again, tags the same trendline zone, and this time forms a small two-legged pullback with a slightly higher low on the second leg. That’s the qualified second entry: stop goes below the recent swing low, target sits at the prior high, and the trade risks roughly 1% of account equity.
Now consider a breakout example on a forex pair. Price has compressed under a resistance level tested three times over two sessions. A full-bodied close finally clears that level on the fourth test. Rather than chasing the breakout candle, the PATs trader waits for a retest, watches price hold above the old resistance (now support), and enters on the bounce with a stop tucked back inside the prior range.
A reversal example looks different again: an uptrend prints a lower high for the first time in days, breaking the prior sequence of higher highs. Price retests that broken structure, fails to reclaim it, and rolls over. The entry triggers on the failed retest, with the stop placed above the reversal’s extreme high.
Each of these examples follows the same skeleton: context, trigger, entry, stop, target. That repeatability, more than any single winning trade, is what PATs is actually teaching.
How Mack’s PATs Compares To Other Price Action Methods
PATs shares DNA with most serious price-action frameworks. It leans on structure, trendlines, and candlestick behavior rather than lagging indicators, which puts it in the same family as supply-and-demand zone trading and classic support-and-resistance methods.
Where PATs distinguishes itself is the second-entry emphasis. Many price-action systems teach a single pullback entry and move on. Mack’s system builds an entire rule set around the failure-then-retry pattern, treating the first failed attempt as useful information rather than a missed trade.
Compared to structure-break methodologies that rely on formal break-of-structure and change-of-character labeling, PATs uses similar logic but expresses it through trendlines and visual pattern recognition rather than a strict labeling taxonomy. Traders coming from a smart-money-concepts background will recognize the underlying structure logic even though the vocabulary differs.
Against pure candlestick-pattern trading, such as trading isolated pin bars or engulfing candles off common chart setups, PATs is more structural. A candlestick pattern alone rarely triggers a PATs entry; it needs to occur at the right structural location, on the right side of the trend, with the second-entry sequence intact.
No single method wins across every market condition, and PATs is no exception. Its second-entry logic thrives in orderly, trending conditions and struggles more in choppy, range-bound sessions where pullbacks fail to resolve cleanly in either direction.
Adapting PATs To Different Markets And Timeframes
PATs was built around intraday futures and forex charts, but the underlying logic travels reasonably well once you adjust a few variables.
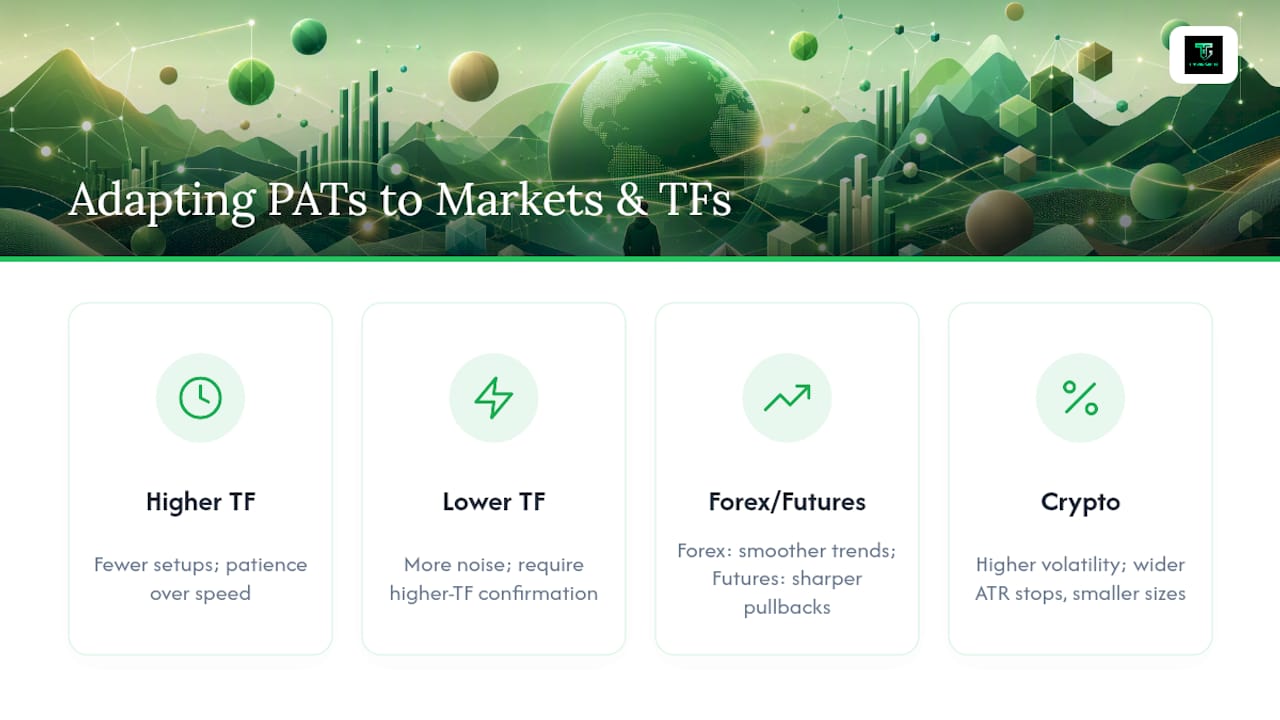
On higher timeframes, such as daily or four-hour charts, the same trendline and second-entry logic applies, but trade frequency drops sharply. Swing traders using PATs concepts on daily charts might see a handful of qualified setups per month rather than several per session, which changes the psychology considerably. Patience becomes the primary skill rather than execution speed.
Moving to different asset classes changes the texture of the setups without changing the rules. Forex pairs tend to trend more smoothly during session overlaps, which suits second-entry pullbacks well. Futures indices can produce sharper, faster pullbacks that test a trader’s patience to wait for the second touch rather than jumping on the first. Crypto markets add their own wrinkle: volatility runs higher, so position sizing and stop distance both need recalibration, often with wider ATR-based stops and correspondingly smaller position sizes to keep dollar risk constant.
Lower timeframes, like 1-minute charts, demand faster execution and tighter stops, but they also generate more noise and more false second entries. Traders adapting PATs downward in timeframe usually need tighter filters, such as requiring a higher-timeframe trend confirmation before taking any lower-timeframe signal, echoing the multi-timeframe decision tree that keeps lower-timeframe noise from overriding the bigger picture.
An Educator’s View On Turning PATs Rules Into Repeatable Habits
Reading a manual and actually executing a second entry under pressure are two different skills, and that gap is where most self-taught PATs traders stall out. Rule lists look complete on paper. They fall apart the first time a trade moves against a trader mid-session and hesitation replaces the checklist.
Structured lessons close that gap through repetition, not through better rules. A curriculum that walks through live sessions, reviews trades in real time, and gathers feedback from a community of traders working the same setups turns an abstract checklist into muscle memory faster than solitary backtesting ever will. Community reports around PATs consistently point to small, consistent position sizing as the difference between traders who stick with the method and those who blow up chasing bigger size too early.
A realistic timeline runs months, not weeks. Expect a learning phase focused purely on pattern recognition, followed by a paper-trading phase, and only then a small-size live phase where mentorship and community feedback catch mistakes before they compound.
— Gabriel
Ready To Turn Mack’s PATs Rules Into A Repeatable Skill?
Reading about second entries and backtesting checklists gets you partway there. The harder part is executing those rules live, under pressure, without a mentor watching your trades and flagging the habit you can’t see yourself falling into. That’s the gap Tradergibkey closes for readers who want structured guidance instead of solo trial and error.

Courses build on the same price-action foundation covered here, offering structured lessons, live trading sessions, and a community of traders working through the same setups together. The program includes journaling templates and trading system checklists so the rules you just read stop being theory and start becoming habit, with mentorship available for traders who want direct feedback on their own charts. If you’re ready to apply price action with actual support behind you, visit Tradergibkey to see the current course and mentorship options and get started this week.
Sources
- Price Action Trading Explained: A Simple Guide for Beginners
- Price Action Trading: A Rules-Based Guide | FundedFast
- Price Action Reader (TradingView script) — Price action market-structure indicator
- Price Action Trading Explained: How to Trade Profitably Without Indicators | Hantec Markets