
The risk-reward ratio measures how much you stand to lose against how much you stand to gain on a single trade, expressed as a simple ratio like 1:2. Treat it as a filter, not a full strategy: it tells you whether a setup is worth risking capital on, but it only becomes profitable when paired with a realistic win rate and consistent position sizing. A great ratio with sloppy execution still loses money.
TL;DR:
- A 1:3 risk-reward ratio requires roughly a 33% win rate to break even, but actual trading costs and slippage often demand a higher win rate.
- Calculate your risk and reward in the correct units for each asset class before entering a trade to ensure accurate position sizing and ratio assessment.
- Breakeven win rates for ratios like 1:2 or 1:3 are 33% and 25% respectively, making high ratio setups viable only if your win rate exceeds these thresholds after costs.
- Realized risk-reward often drops below the planned ratio due to slippage, partial exits, spreads, and commissions, which should be accounted for in target and stop placement.
- Strict pre-trade discipline, including journaling planned versus actual ratios, helps identify execution errors and improves trading consistency over time.
Table of Contents
- What Is the Risk-Reward Ratio and How Do You Calculate It?
- How to Calculate Risk to Reward Step by Step
- Breakeven Win Rate: The Formula That Connects R:R to Profit
- Position Sizing: Turning Your Ratio Into an Actual Trade Size
- Why Your Realized R:R Rarely Matches What You Planned
- Matching Your Risk-Reward Ratio to Your Trading Style
- Common Risk-Reward Mistakes That Quietly Kill Accounts
- Your Pre-Entry Checklist for Applying Risk-Reward Ratio
- What 18 Years of Live Trading Teaches You About Risk-Reward
- Where Risk-Reward Fits in a Trader’s Actual Toolkit
- Learn to Apply Risk-Reward With Guided, Live Trading Support
- Sources
What Is the Risk-Reward Ratio and How Do You Calculate It?
Risk-reward ratio, sometimes shortened to R:R or called the reward-to-risk assessment, compares the distance from your entry to your stop-loss against the distance from your entry to your profit target. Investopedia’s definition frames it plainly: divide your potential reward by your potential risk, and you get a number that tells you whether a trade is structurally worth taking before you ever click the buy button.
The formula looks like this:
Risk = Entry price − Stop-loss price Reward = Take-profit price − Entry price Risk-reward ratio = Reward ÷ Risk
Say you buy at $50, place a stop at $48, and target $56. Your risk is $2, your reward is $6, and your ratio is 3:1, usually written as 1:3 when risk is normalized to one unit. That convention trips up a lot of newer traders, so pick one notation and stick with it. Throughout this article, we write ratios as risk:reward, meaning 1:3 signals you’re risking one unit to make three.
Units matter as much as the math itself. A ratio calculated in the wrong denomination is meaningless once you scale a position:
- Forex: measured in pips, where a pip’s dollar value shifts with lot size and currency pair.
- Stocks: measured in dollars per share, which converts cleanly into position-sizing math.
- Futures and indices: measured in points or ticks, each carrying its own contract-specific dollar value.
- Crypto: often measured in percentage terms because price scales vary so wildly between assets.
Get the unit wrong and every downstream calculation, including your position sizing, inherits that error.
How to Calculate Risk to Reward Step by Step
Calculating risk to reward forex-style, stock-style, or index-style follows the same three moves every time: find your risk in price units, find your reward in price units, then divide. Here’s how that plays out across asset classes.
- Mark your entry, stop, and target before you place the trade. Structure comes first, math comes second. Never work backward from a ratio you like.
- Convert the stop and target distances into price units. Pips for forex, dollars for stocks, points for futures.
- Divide reward by risk. That number is your planned R:R, and it should be calculated and logged before the order goes live, not adjusted afterward.
- Cross-check against your win-rate expectations. A 1:1 ratio needs a much higher win rate to profit than a 1:3 ratio does, covered in detail below.
Forex example: You go long EUR/USD at 1.0850, stop at 1.0820 (30 pips risk), target at 1.0940 (90 pips reward). That’s a 1:3 ratio. On a standard lot, 30 pips of risk equals roughly $300, and a 1:3 setup puts your reward near $900, before spread and commission adjustments.
Stock example: You buy 200 shares at $40, with a stop at $38 ($2 risk per share, $400 total) and a target at $46 ($6 reward per share, $1,200 total). That’s a 1:3 ratio too, but notice the position size, 200 shares, is what converts a per-share number into an account-level dollar figure. Get the share count wrong and the ratio stays the same, but your actual dollar exposure doesn’t match your risk plan.

Index example: Trading the S&P 500 futures contract, a 10-point stop and a 25-point target gives you a 1:2.5 ratio. Multiply by the contract’s dollar-per-point value (typically $50 for the E-mini) to see real dollar risk and reward. Index traders juggling multiple legs, like spreads or calendar trades, should calculate R:R on the net debit or credit rather than on any single leg in isolation.
Pro Tip: Build a simple spreadsheet with columns for entry, stop, target, and a formula cell that auto-calculates your ratio. Feeding it into a calculator before every trade takes ten seconds and kills the temptation to eyeball it.
Key figures worth memorizing: a 1:2 ratio needs roughly a 33% win rate to break even before costs, while a 1:1 ratio needs north of 50%, according to FundedFast’s breakeven framework. That single relationship explains why so many profitable traders lose more often than they win and still come out ahead.
Breakeven Win Rate: The Formula That Connects R:R to Profit
Here’s the number that actually matters more than the ratio itself: your breakeven win rate. A 1:3 risk-reward strategy sounds appealing, but it’s worthless if your actual win rate can’t clear the breakeven bar the math demands.
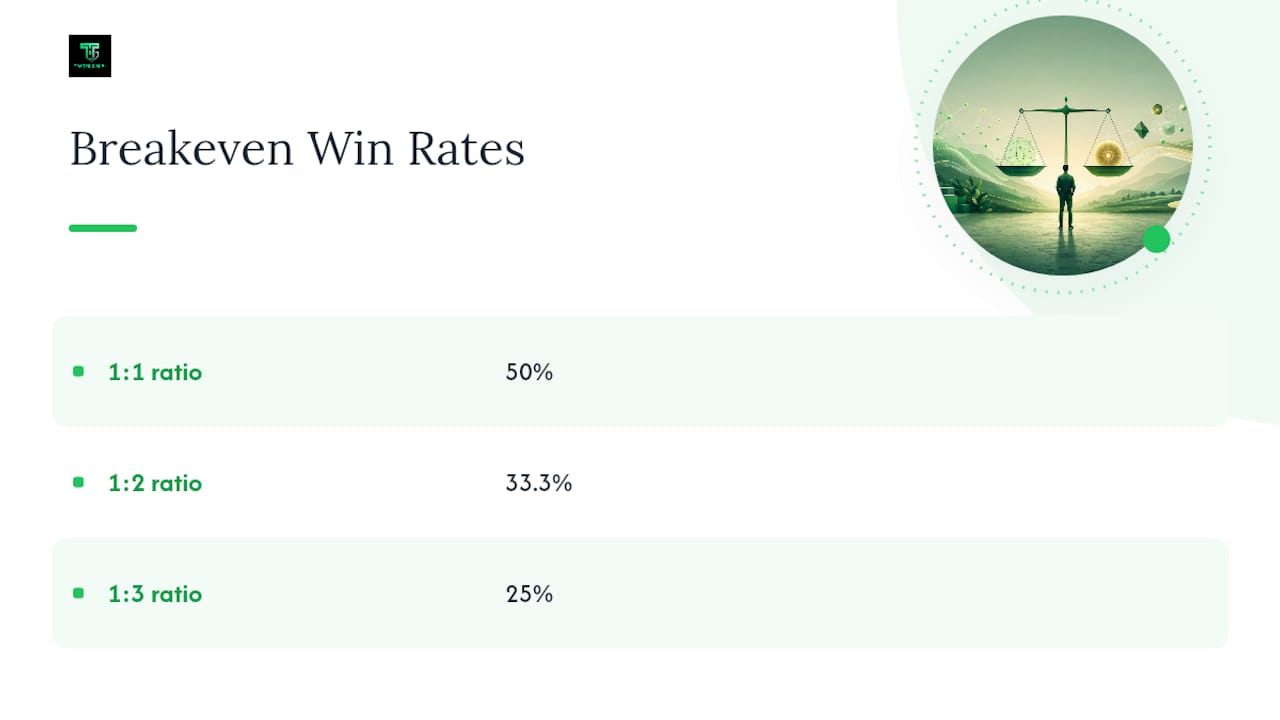
The formula is straightforward:
Breakeven Win% = 1 ÷ (1 + R-multiple)
where the R-multiple is your reward divided by your risk. Plug in a 1:2 ratio (R-multiple of 2), and you get 1 ÷ 3 = 33.3%. Anything above that win rate, assuming your ratio holds, produces a positive expectancy.
These figures come before fees, spreads, or slippage are factored in, and FundedFast’s guidance notes that trading costs push the real breakeven threshold slightly higher than the raw math suggests. A scalper paying tight but frequent spreads might need a win rate a few points above the table’s number just to stay neutral.
Expectancy is what ties this all together into a single dollar figure per trade. The formula:
Expectancy = (Win rate × Average win) − (Loss rate × Average loss)
Say you trade a 1:2 setup with a 40% win rate, risking $100 per trade. Your average win is $200, your average loss is $100. Expectancy = (0.40 × $200) − (0.60 × $100) = $80 − $60 = $20 per trade. That’s a positive $20 expectancy despite losing on six out of ten trades. This is the entire reason experienced traders gravitate toward 1:2 to 1:3 ratios: those ratios let you build a profitable system while being wrong more often than you’re right.
Run the same math on a 1:1 ratio with the same 40% win rate, and expectancy turns negative immediately. That’s the gap between a ratio that sounds fine and one that actually survives contact with real trading.
Position Sizing: Turning Your Ratio Into an Actual Trade Size
A risk-reward ratio without a position size attached is an abstraction. The number that actually protects your account is how many units, shares, or lots you trade, and that number comes from a formula, not a gut feeling.
Position size = (Account risk in dollars) ÷ (Stop-loss distance in price units)
Using an example grounded in Binance Academy’s framework: a $10,000 account risking 1% per trade allocates $100 of risk. If your stop is 5% away from your entry, your position size is $100 ÷ 0.05 = $2,000 worth of exposure. Risk 2% instead of 1%, and that same 5% stop lets you size up to $4,000, doubling both your risk and your reward at the same ratio.
This is the mechanic most new traders miss: the risk-reward ratio stays constant regardless of position size, but the dollar reward scales directly with how much you’re willing to risk. A 1:3 setup risking $100 nets a $300 target. The same 1:3 setup risking $300 nets a $900 target. Your ratio hasn’t changed. Your exposure has.
A few practical notes worth keeping in your trading routine:
- Keep per-trade risk between 1% and 2% of account equity; anything higher turns a normal losing streak into a account-threatening one.
- Recalculate position size every single trade. Stop distances change with volatility, and a fixed lot size ignores that.
- Leverage multiplies both position size and risk simultaneously. A wider stop combined with high leverage can put far more capital at risk than the percentage rule intends.
- Watch margin requirements separately from risk percentage. You can be within your risk rule and still get a margin call if leverage is stretched too thin.
Pro Tip: Calculate position size before you look at the chart’s price action that day. Deciding your dollar risk first, then fitting the trade to it, keeps emotion out of a number that should be purely mechanical. For a deeper walkthrough on this, our guide to position sizing in practice covers account-scaling scenarios in more detail.
Why Your Realized R:R Rarely Matches What You Planned
Here’s something most trading education skips: the ratio you calculate before entering a trade and the ratio you actually capture are usually two different numbers. TradingSim’s research on day-trading execution points to slippage, partial exits, and trailing stops as the main culprits that erode a planned 1:3 into a realized 1:2, or worse.
Slippage happens when your order fills at a worse price than intended, common during high volatility or low liquidity. A stop meant to cap risk at $100 might execute at $115 during a fast move. Partial exits, where you scale out of a portion of a position early to lock in gains, reduce your average captured reward even when the trade eventually hits your full target. Trailing stops protect profit but almost always close a portion of the trade before the absolute best price, which is the trade-off you’re accepting for reduced risk of giving profit back.
Spreads, commissions, and overnight funding rates quietly shrink your effective reward too. ThinkMarkets’ analysis suggests widening targets slightly to compensate for these costs, especially for short-duration trades where fees represent a larger share of the total move.
Where you place your stop matters more than most traders realize:
- Set stops beyond obvious structure (recent swing highs/lows), not at round numbers where everyone else’s stop sits too.
- Use the Average True Range (ATR) to size stops relative to current volatility instead of a fixed pip or dollar amount.
- Widening a stop to survive noise means recalculating your position size to keep dollar risk constant, never skip this step.
- Accept that a stop placed too tight for the asset’s normal volatility will get hit by noise regardless of your directional read being correct.
For more on placing stops that actually hold up, see our practical guide to stop-loss setting. Reviewing Tickerly’s primer on risk-reward mechanics can also help clarify how these execution frictions interact with the base math.
Matching Your Risk-Reward Ratio to Your Trading Style
A scalper chasing a 1:3 ratio is usually fighting their own strategy. Realistic R:R targets shift dramatically depending on your holding period, and forcing a ratio that doesn’t fit your style is one of the fastest ways to sabotage an otherwise sound approach.
- Scalping typically runs near 1:1, since trades last seconds to minutes and there simply isn’t room for price to travel far enough to support a wider target before the setup invalidates.
- Day trading usually sits in the 1:1.5 to 1:2 range, balancing intraday volatility against the practical limits of a single session’s price movement.
- Swing trading commonly reaches 1:2 to 1:3 or higher, since multi-day holds give price the room needed to develop larger moves relative to a tighter, structure-based stop.
- Options strategies vary widely by structure, a debit spread and a naked long call carry entirely different risk-reward profiles even on the same underlying.
Volatility, liquidity, and spread costs all shape which ratio is realistic for a given market. A tight-spread major forex pair supports different ratio math than a thinly traded small-cap stock, even using an identical strategy. Before locking in a target range, run through this checklist:
- Does this asset’s historical volatility support the distance to my target within my typical holding period?
- What’s my setup’s actual historical win rate across the last 100+ occurrences, not just the last five?
- Are spread and commission costs a meaningful percentage of my planned risk on this specific trade size?
- Does my stop placement reflect real market structure, or am I reverse-engineering it to hit a ratio I want?
Common Risk-Reward Mistakes That Quietly Kill Accounts
Most traders don’t blow up because they misunderstand the formula. They blow up because they misuse it in ways that feel reasonable in the moment.
- Forcing a ratio onto a poor setup. Wanting a 1:3 trade and stretching your target to an unrealistic resistance level, just to hit that number, produces a target that price was never likely to reach. The ratio looks great on paper and fails in practice because it wasn’t grounded in structure.
- Moving your stop after entry. Widening a stop to avoid taking a loss changes your planned R:R after the fact, and it destroys the statistical basis your expectancy math was built on. If a trade needs a wider stop, that decision belongs before entry, recalculated through position sizing, not as a rescue mid-trade.
- Judging a ratio without checking win rate or costs. A 1:1 ratio isn’t automatically bad and a 1:3 isn’t automatically good. What matters is whether your actual win rate clears the breakeven threshold for that specific ratio, after spreads, commissions, and slippage are subtracted.
Your Pre-Entry Checklist for Applying Risk-Reward Ratio
Turning the math into a habit means running the same sequence before every single trade, not just the ones that feel important.
- Identify structure first. Mark the swing high/low or ATR-based level that defines your stop before you think about targets.
- Set your target based on real resistance/support or measured moves, not on what ratio you’re hoping to hit.
- Calculate the ratio. Reward divided by risk, in the same price units, logged before you place the order.
- Calculate position size using your account risk percentage and the stop distance, keeping dollar risk consistent trade to trade.
- Factor in spread, commission, and expected slippage to get a realistic, rather than theoretical, ratio.
Your trading journal should capture both the planned R:R and the realized R:R for every trade, side by side. Add columns for entry, stop, target, position size, and outcome. Over 50 to 100 trades, that gap between planned and realized numbers tells you more about your execution discipline than any single win or loss ever will.
Pro Tip: Set a hard rule: if your calculated position size at proper risk percentage makes the trade impractical (an odd-lot share count, or a lot size your broker doesn’t support), skip the trade entirely rather than bumping your risk percentage to make it fit.
What 18 Years of Live Trading Teaches You About Risk-Reward
Numbers on a spreadsheet are easy. Holding to them when a trade is moving against you in real time is a different discipline entirely, and it’s the gap between traders who talk about R:R and traders who actually apply it under pressure.
The habit that separates consistent traders from everyone else isn’t a secret formula. It’s boring repetition: journaling every trade’s planned and realized ratio, reviewing that data across 100 or more trades before drawing conclusions about an edge, and refusing to let a single bad trade rewrite the rules. Stops set at structure, sized with ATR to account for current volatility, hold up far better than stops set at arbitrary round numbers or “gut feel” distances.
A stop placed just beyond the last swing low, with position size calculated off that distance, respects both the chart and the account. A stop placed because it “feels close enough” respects neither, and it shows up in your equity curve within a few dozen trades, whether you’re watching for it or not.
Community accountability plays a bigger role in this than most solo traders expect. Reviewing trades alongside other disciplined traders, inside a structured environment built around risk management principles rather than tips and signals, catches the small rule-breaks before they become expensive patterns. The traders who improve fastest are usually the ones willing to have their journal read by someone else, not just themselves.
Where Risk-Reward Fits in a Trader’s Actual Toolkit
Risk-reward ratio is a filter, not a system. That’s the framing I’d push back on hardest: too much trading content treats R:R like a standalone edge, when really it’s a screening tool that helps you disqualify weak setups and size positions sensibly once you’ve already found a valid structure-based trade.
The math in this article, breakeven win rates, expectancy calculations, position-sizing formulas, only means something once you’re logging it trade by trade and testing it against your own results rather than a textbook example.
Record your planned and realized ratios every single trade. Watch how they diverge. That gap is where the real learning happens, far more than in any formula on this page.
If you’re still building the execution side of this, structure-based stops, entry timing, reading price action without relying on lagging indicators, that’s exactly the gap guided mentorship is built to close.
— Gabriel
Learn to Apply Risk-Reward With Guided, Live Trading Support
Reading the formulas is one thing. Applying them under pressure, in a live market, with real capital on the line, is where most traders actually struggle, and it’s the gap Tradergibkey was built to close.

Tradergibkey’s structured courses, personalized mentorship, and live trading sessions focus on practical price-action stops and position sizing, not generic indicator signals that ignore the math this article just walked through. You get daily market analysis, a supportive trading community for accountability, and journaling tools built specifically to track planned versus realized risk-reward across every trade you log. The emphasis stays on repeatable execution: structure your stop, size your position, calculate your ratio before entry, then review the outcome honestly.
If you want to stop treating risk-reward ratio as theory and start applying it inside a disciplined, mentored framework, visit Tradergibkey to see the current course and mentorship options and find the path that matches where you’re at right now.
Sources
A handful of resources back the calculations and ranges covered above, worth keeping on hand if you want to verify or dig deeper:
- Risk/Reward Ratio Definition | Investopedia
- Risk to reward ratio: A guide to risk-reward in trading | ThinkMarkets
- Risk-Reward Ratio: Calculate, Apply & Trade Smarter | FundedFast
This article is general information, not a substitute for advice from a qualified financial advisor. Consult a qualified financial professional about your own circumstances before acting on anything here.