Trading expectancy is the average amount you can expect to win or lose per trade, calculated as (win rate × average win) minus (loss rate × average loss). A positive number means your strategy has a real edge over time; a negative number means you’re paying the market to let you trade. Everything else, the formula, the benchmarks, the fixes, comes after that one number tells you where you stand.
TL;DR:
- Traders should run expectancy calculations after costs to accurately determine if their strategy has a real edge, as gross gains can be wiped out by trading expenses.
- A trading expectancy below 0.1R is marginal, while 0.3R is considered solid and 0.5R or above is excellent, but the true value depends on enough trade samples.
- Reliable expectancy estimates require at least 60 to 100 trades, with 200 or more trades necessary to properly account for random variance.
- Improving expectancy involves letting winners run, tightening stop-losses, filtering setups more strictly, and testing changes on single setups before scaling.
- Position size should be based on expectancy, with risks capped at 1-2% per trade for well-tested strategies, considering volatility and drawdown tolerance.
Table of Contents
- How Do You Calculate Trading Expectancy?
- What Counts as a Good Trading Expectancy?
- How Many Trades Do You Need for Reliable Expectancy?
- What Are the Best Ways to Improve Trading Expectancy?
- How Does Expectancy Relate to Profit Factor and Drawdown?
- How Should Expectancy Guide Your Position Sizing?
- What Should You Track to Calculate Expectancy Accurately?
- Key Takeaways: Your Next Steps With Trading Expectancy
- The Part of Trading Expectancy Most Traders Get Backwards
- Sources
How Do You Calculate Trading Expectancy?
The formula is short enough to memorize in one read: Expectancy = (Win% × Average Win) − (Loss% × Average Loss). Plug in your own numbers and you get the average expected profit or loss per trade, not per week, not per month. Per trade.
That last part matters because raw cash numbers don’t travel well between accounts. A $50 average win on a $10,000 account means something different than a $50 win on a $100,000 account. That’s why most serious traders convert expectancy into R-multiples, where R equals the amount you risked on the trade. A win of 2R means you made twice what you risked. Expressing expectancy in R lets you compare strategies across account sizes and even across different markets without the dollar signs getting in the way.
Here’s how that plays out in three common trading styles:
- Trend-following, low win rate, big winners. You win 35% of trades at an average of 3R, and lose 65% at an average of 1R. Expectancy = (0.35 × 3) − (0.65 × 1) = 1.05 − 0.65 = +0.40R. Most trades lose, but the strategy is strongly profitable because the winners dwarf the losers.
- High win rate, small edge per trade. You win 70% of trades averaging 0.5R, and lose 30% averaging 1R. Expectancy = (0.70 × 0.5) − (0.30 × 1) = 0.35 − 0.30 = +0.05R. Technically positive, but thin enough that costs can erase it.
- Breakeven scalping before costs. You win 50% at 1R and lose 50% at 1R. Raw expectancy is exactly 0R. Now subtract commissions and slippage of 0.08R per trade, and you’re sitting at −0.08R. A statistically neutral system becomes a guaranteed loser once you account for real trading costs.
That third example is the one most new traders miss. Always run expectancy after costs, not before. The gap between gross and net can be the entire difference between a viable system and a slow bleed.
What Counts as a Good Trading Expectancy?
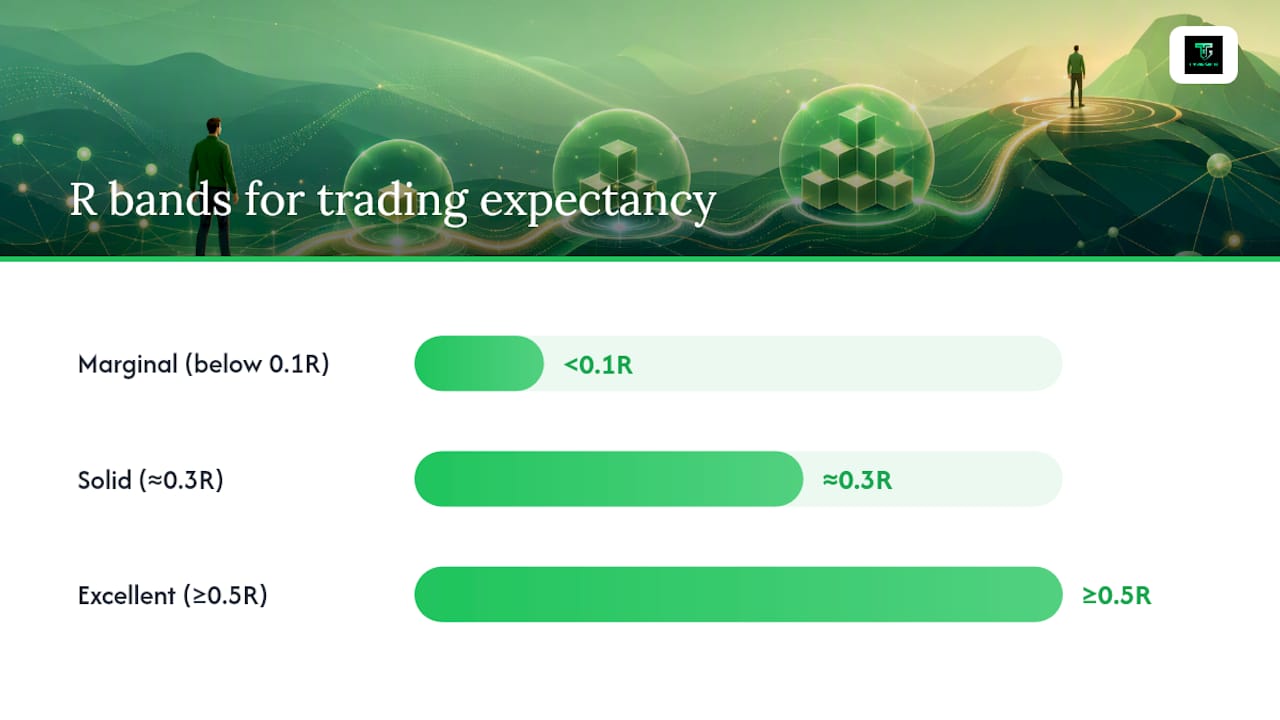
Not every positive number deserves your confidence. Industry practice generally uses these rough bands for R-multiples:
- Below 0.1R: marginal. Technically an edge, but easily wiped out by a bad execution week.
- Around 0.3R: solid. This is the level most consistently profitable retail traders operate around, and it’s a widely cited threshold for a robust retail edge.
- 0.5R and above: excellent, and rare enough that you should double check your math before celebrating.
Statistic Callout: A strategy sitting at 0.3R across 100 trades risking 1% of capital each time nets roughly 30% growth in R terms before compounding, a meaningful return, but only if the sample size backs it up.
Translating R into cash depends entirely on your position size and risk per trade. A day trader risking $100 per trade at 0.3R nets about $30 per trade on average; a swing trader risking $1,000 nets $300. The R-multiple stays constant. The dollar outcome scales with how much you put on the line, so never compare cash figures between traders without asking what they risked to get there.
How Many Trades Do You Need for Reliable Expectancy?
A single winning week tells you almost nothing. Expectancy is a statistical average, and averages need volume before you can trust them.
- 30 trades: enough for a rough directional hint, nothing more. Treat any conclusion here as tentative.
- 60 to 100 trades: a practical baseline for judging whether a strategy is worth continuing. This range gives you a reasonable working confidence level without waiting months.
- 200-plus trades: this is where the noise settles and you can trust the number enough to size up.
Variance is the reason for the wide range. Two traders running the identical system can post wildly different 20-trade stretches purely by chance, and one bad losing streak can flip an early expectancy calculation from positive to negative even when the underlying edge is fine. Rolling-window tracking, recalculating expectancy over your last 50 or 100 trades, smooths this out and helps you spot real decay from normal variance. Tag every trade by setup, too. A blended average across three strategies can hide the fact that one setup carries the whole account.
What Are the Best Ways to Improve Trading Expectancy?
Once you know your number, four levers move it, and they’re not equally powerful.
- Let your winners run. Trailing stops and partial profit-taking increase your average win without touching your win rate. This usually delivers the biggest expectancy gain for the least behavioral effort.
- Tighten your average loss. Sloppy stop placement, late exits, and hesitation on cutting losers quietly erode expectancy trade after trade. Fixing execution discipline here often recovers more edge than people expect.
- Filter harder before you enter. Cutting your lowest-quality setups raises win rate by removing trades that were barely coin flips to begin with. Fewer trades, better average outcome.
- Measure every change per-setup before scaling. Don’t roll a change out across your whole system. Test it on one setup, confirm net expectancy improved after costs, then expand.
Pro Tip: Change one variable at a time. If you tighten stops and loosen your entry filter in the same week, you won’t know which move actually helped your expectancy, and you’ll waste a full sample size finding out the hard way.
A risk to reward pre-entry checklist can help you catch weak setups before they ever make it into your log, which is cheaper than fixing them after the fact.
How Does Expectancy Relate to Profit Factor and Drawdown?
Expectancy tells you the average outcome per trade. It doesn’t tell you the whole story alone.
- Expectancy answers “is there an edge here at all?” It’s the foundation metric, and it’s widely regarded as the single most predictive number for whether a strategy makes money over time.
- Profit factor (gross profit divided by gross loss) answers a related but different question: how much you make for every dollar you lose. A profit factor of 1.5 means $1.50 earned for every $1.00 lost.
- Maximum drawdown answers the survival question. Drawdown shapes trader behavior more than almost any other metric, because a 25% account dip is what makes people abandon a system that was actually working fine.
- Sharpe ratio answers how smooth the equity curve is relative to its volatility, useful for comparing two strategies with similar expectancy but very different ride quality.
Run all four together during a performance review. Expectancy alone can look great on paper while drawdown quietly makes the strategy untradeable in practice.
How Should Expectancy Guide Your Position Sizing?
Expectancy isn’t just a scorecard. It’s an input for how much to risk per trade.
The Kelly Criterion connects the two directly: it calculates an “optimal” bet size from your win rate and payoff ratio. The connection between expectancy and Kelly sizing is well established, but full Kelly is almost always too aggressive for retail accounts. It assumes your win rate and average win are exactly correct going forward, and real markets don’t grant that certainty.
Statistic Callout: A trader using full Kelly on a strategy with true 0.3R expectancy will typically see drawdowns two to three times deeper than a trader using a quarter-Kelly fraction, for the same long-run growth rate.
Practical guidance that holds up across account sizes:
- Weak or unproven edge (below 0.1R, under 100 trades): cap risk at 0.5% to 1% per trade.
- Solid, tested edge (around 0.3R, 100+ trades): 1% to 1.5% is defensible.
- Excellent, well-sampled edge (0.5R+, 200+ trades): up to 1.5% to 2% maximum, rarely more.
Volatility and drawdown tolerance sit alongside expectancy in this decision. A high-expectancy strategy on a volatile instrument still needs smaller position sizes than the raw number suggests, because the same edge on a wilder equity curve can still push you past your psychological breaking point. Position sizing rules built around risk-per-trade are worth setting in writing before you need them, not while you’re mid-drawdown.
What Should You Track to Calculate Expectancy Accurately?
Your journal is only as useful as the fields you log. At minimum, record:
- Entry price, exit price, and the date/time of each trade.
- Gross P&L and net P&L (after commissions, spread, and slippage).
- The R-multiple result, not just the dollar amount.
- Setup tag, instrument traded, and which version of your strategy rules you were following.
A compact metric set covering trade count, win rate, average win/loss, expectancy, profit factor, and R-distribution is enough to run a full review without drowning in spreadsheet columns. Calculate expectancy separately for each setup and instrument. A single blended number can hide a strategy where one setup carries positive expectancy and another quietly loses money underneath it. Review rolling 50 to 100 trade windows monthly, and treat two consecutive negative rolling windows as your trigger to pause and investigate rather than push through. A structured performance review process turns this from a vague habit into a repeatable check.
Key Takeaways: Your Next Steps With Trading Expectancy
Three actions to take before your next trading session:
- Calculate your net expectancy right now, using your last 30 to 100 trades and after-cost numbers, not gross.
- Convert it to R so you can compare it against the 0.1R, 0.3R, and 0.5R benchmarks and know exactly where you stand.
- Break it down per setup. One weak setup dragging down two strong ones is one of the most common, and most fixable, problems in a trading journal.
Revisit the whole calculation after 50 to 200 new trades, not after three good days or three bad ones. Expectancy rewards patience with the data more than it rewards cleverness with the strategy.
The Part of Trading Expectancy Most Traders Get Backwards
Most traders treat expectancy as a report card, something you check after the fact to see how you did. That’s backwards. Expectancy is a design constraint, something you calculate before you scale size, add capital, or tell yourself a strategy is “working.”
Here’s what the conventional advice gets wrong: it talks about expectancy as a single number, as if one calculation settles the question. It doesn’t. A blended expectancy across five setups and three instruments tells you almost nothing actionable. You need it broken apart, setup by setup, before you can tell which piece of your trading is actually earning its keep and which piece is quietly funded by the rest.
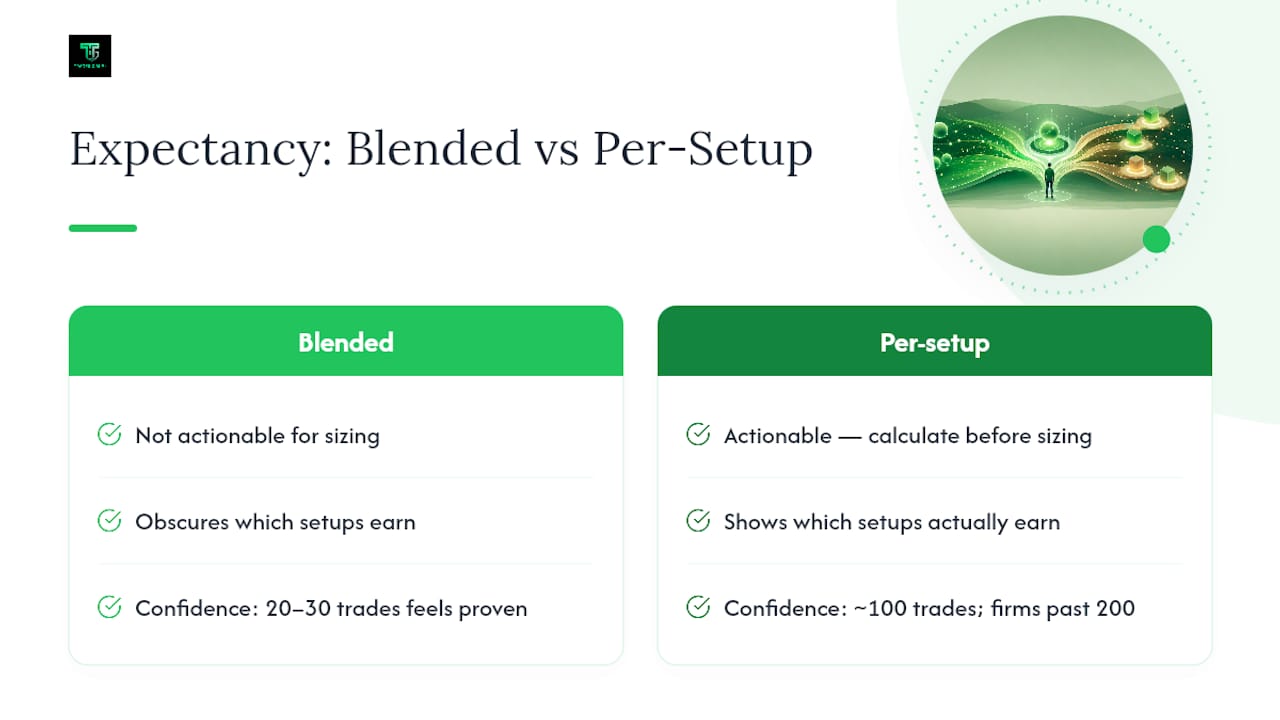
The other gap is patience with sample size. Traders love to declare an edge “proven” at 20 or 30 trades because that’s when the emotional relief of a winning stretch peaks. Real confidence starts closer to 100 trades, and it only firms up past 200.
If you take one thing from this: calculate net expectancy per setup before you touch your position size, not after.
— Gabriel
Sources
- Expectancy: Definition, Formula & Calculator | TradesViz
- Forex-basics
- Trading Expectancy Formula: Calculate Your Edge (2026)
- Trade Expectancy Calculator - Measure Your Edge