
Trend line trading works when you draw the line correctly and trade it with rules, not hope. Two trade modes matter: the bounce, where you ride the trend as price respects the line, and the break, where a confirmed close and retest signal a hand-off to a new direction. Both demand a validated line, a clear stop, and sized risk before you click buy or sell.
TL;DR:
- Valid trend lines require a minimum of three touches, with the third confirming the trend’s slope and making the line tradable.
- Trade bounce setups with a rejection candle and shallow slope on orderly, high-timeframe lines; breaks need a full candle close beyond the line followed by retest.
- Higher timeframe trend lines with three or more confirmed touches and moderate slopes (20–45 degrees) are more reliable for trading decisions.
- Proper risk management involves setting stops just beyond rejection wicks or retest levels, sizing positions based on account risk, and targeting recent swing highs or lows.
- Avoid forcing trend lines, redrawing them excessively, or trading steep lines, as these habits increase false signals and lead to premature or failed trades.
Table of Contents
- What Trend Lines Are and Why They Matter
- How to Draw Valid Trend Lines Step by Step
- How to Trade Trend Lines: Bounce vs Break
- Timeframes, Slope, and Touch Count for Reliability
- Entry, Stop Placement, and Target Setting
- Common Mistakes, False Breaks, and Stop-Hunt Patterns
- Channels, Multiple Trend Lines, and Advanced Uses
- Trader Gibkey’s Practical Checklist and Example Workflow
- When Trend Line Trading Fits Your Development
- How Trader Gibkey Can Help You Trade This With Structure
- Sources
What Trend Lines Are and Why They Matter
A trend line connects at least two pivot lows in an uptrend or two pivot highs in a downtrend, forming a diagonal rail that acts as dynamic support or resistance. That’s the technical definition. What it means for you is simpler: it’s a visual record of who’s been winning the fight between buyers and sellers, and at what price they keep stepping back in.
Two points let you draw a line. A third touch is what makes it worth trading, according to the drawing standards laid out in ChartSchool’s trend line guide. Before that third touch, you’re guessing at a pattern. After it, other traders are watching the same line, which is part of why it starts to work as a self-fulfilling zone of interest.
That said, a trend line by itself is a thin piece of evidence. Investopedia notes that trendlines are fundamental charting tools but can throw false signals when used alone, which is why the strongest trades pair a trend line with something else: a horizontal support level, a volume spike, or a momentum reading.
A few things a trend line tells you at a glance:
- The general speed and direction of the move (steep versus shallow).
- Where buyers or sellers have already defended a price, and might again.
- Whether the trend is accelerating, flattening, or losing conviction between touches.
How to Draw Valid Trend Lines Step by Step
Most bad trend line trades start with a badly drawn line. Here’s the sequence that keeps you honest:
- Pick your swing points first, not your bias. Identify the two most obvious pivot lows (uptrend) or pivot highs (downtrend) on the chart, before you decide what you want the line to say.
- Choose wicks or bodies, and stick with it. Wicks capture the full range of panic and greed; bodies capture where price actually settled. Pick one method per chart and don’t switch mid-analysis just to make a line fit.
- Connect two points, then wait for a third. The third touch is your tradeability signal, confirming the same slope has held across a third separate swing.
- Check the spacing. Points crammed too close together are noise, not structure. Points too far apart may belong to two different trends entirely.
- Match your timeframe to your holding period. A trend line on the 15 minute chart won’t survive a multi day swing trade. Draw on the timeframe you actually plan to hold through.
- Use a log scale on anything with a big percentage move, especially stocks or crypto pairs that have run hard, since a linear scale will distort the true angle of the trend.
- Treat the line as a zone, not a laser. Give it a few pips or ticks of breathing room on either side rather than expecting price to respect it to the decimal.
Pro Tip: Take a screenshot every time you draw a new trend line and mark the exact candles you used for touches one, two, and three. Six months from now, that screenshot habit will teach you more about your own drawing tendencies than any strategy video will.
How to Trade Trend Lines: Bounce vs Break
The bounce and the break are opposite bets, and confusing them is how traders lose money on a line that was actually fine.
The bounce (with-trend) template assumes the trend is intact and the line will hold again. You want to see price approach the line, print a rejection candle (a pin bar, an engulfing candle, or a clear wick rejection), and close back in the direction of the trend. Entry comes on that close, or on the next candle’s open. Your stop sits just beyond the rejection wick, outside the noise a stop-hunt might create. Your target is the most recent swing high or low, or the opposite rail if you’re trading inside a channel.
The break (reversal or hand-off) template assumes the line is about to fail. TradingWithRayner’s guidance on trend line breaks is blunt about this: a wick poking through the line isn’t a break, it’s a probe. You need a full candle close beyond the line, ideally with volume expansion, before you treat the structure as changed. The higher-probability entry isn’t the breakout candle itself. It’s the retest, where price comes back to kiss the broken line from the other side and gets rejected. Your stop goes just beyond that retest high or low.
Which one should you take? Trend health decides it. A line with a shallow, consistent slope and three or more clean touches favors the bounce. A line that’s gotten steep, with touches spaced closer and closer together, is telling you the trend is exhausting itself and a break is more likely to stick.
| Approach | Entry trigger | Stop placement | Best market condition |
|---|---|---|---|
| Bounce | Rejection candle close at the line | Beyond the rejection wick | Shallow slope, 3+ clean touches |
| Break | Candle close beyond line, then retest rejection | Beyond the retest high/low | Steepening slope, touches compressing |
One-line checklist for each: bounce needs a rejection candle plus trend intact; break needs a close beyond the line plus a retest that holds.
Timeframes, Slope, and Touch Count for Reliability
Not every trend line deserves the same trust. Three variables decide how much weight to give one: the timeframe it’s drawn on, its slope, and how many times price has already respected it.
Higher timeframe lines carry more weight because they represent more accumulated decision making. A trend line on the daily or 4 hour chart has survived more news cycles, more session overlaps, and more competing opinions than a line drawn on the 5 minute chart, which Investopedia points out tends to be far more volume-sensitive and prone to needing constant redrawing.
Slope matters just as much. ChartSchool’s angle guidance puts the sustainable range around 20 to 45 degrees. Anything steeper usually reflects a short-term spike in enthusiasm (or panic) that the market can’t keep pace with, and those ultra-steep lines tend to break sooner rather than later.
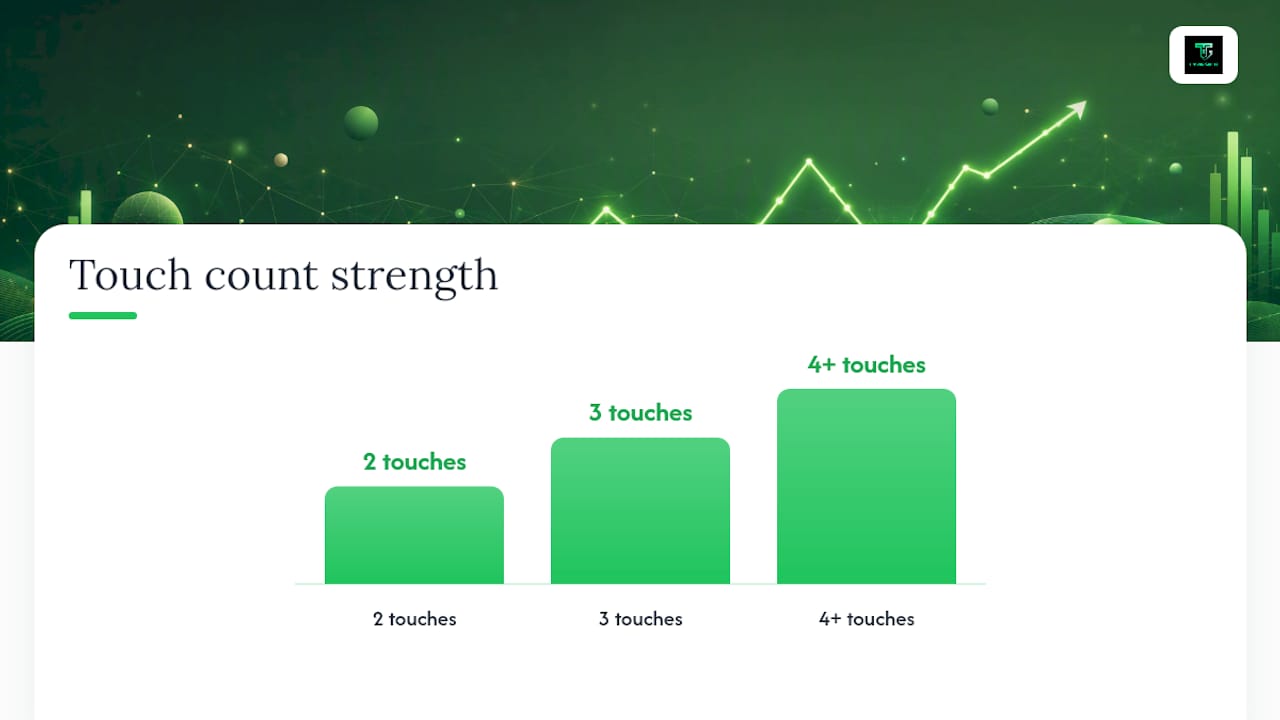
Touch count is your final filter, and the rule of thumb is simple:
- Two touches draw the line, but that’s a hypothesis, not a trade.
- Three touches confirm it’s tradeable.
- Four or more touches make it genuinely strong, because each additional respected touch adds social validation as more traders start watching the same level.
When you’re choosing between two valid lines on the same chart, favor the one that combines a higher timeframe, a moderate slope, and more confirmed touches. That combination is your best proxy for a line the broader market actually respects.
Entry, Stop Placement, and Target Setting
Getting the direction right doesn’t matter much if your risk management is sloppy. Here’s the sequence that keeps a good trend line idea from turning into an account-draining habit.
- Set your stop before you calculate anything else. For a bounce, that’s beyond the rejection wick or the nearest structural swing. For a break trade, it’s beyond the retest high or low, not the original breakout candle.
- Measure the distance in pips or points from entry to stop. This is your risk unit, and it’s the number everything else gets built around.
- Size your position from your account risk, not your gut. Decide what percentage of your account you’re willing to risk (many traders use 1% as a baseline), then divide that dollar amount by your pip or point risk to get position size.
- Set your first target at the nearest logical rail. That’s the prior swing high or low, or the opposite side of a channel if one exists.
- Decide upfront whether you’re scaling out or taking a single target. Scaling out (closing part of the position at the first rail, letting the rest run) smooths your equity curve. A single target is simpler and easier to journal consistently.
- Check a higher timeframe before you pull the trigger. A quick look at the next timeframe up can confirm the trend line’s context and often lets you tighten your stop with more confidence.
Pro Tip: If your calculated position size for a valid setup feels uncomfortably small, that’s not a reason to widen your stop. It’s a signal your stop distance is too wide for that pair or timeframe, and you’re better off skipping the trade.
Common Mistakes, False Breaks, and Stop-Hunt Patterns
Most trend line losses trace back to one habit: forcing a line to fit the price instead of letting the price define the line. If you’re redrawing the same line five times to make it touch a candle, stop. That’s not analysis anymore.
A few other traps worth flagging:
- Treating a steep line as reliable just because it’s been touched twice; steep lines break fast and often.
- Reading a wick through the line as a break; ChartSchool is clear that a wick is a probe, not a confirmed structural change.
- Ignoring the bigger picture, like nearby horizontal support and resistance or a break of structure / change of character setup that would corroborate or contradict the trend line signal.
Quick validation checklist before entry: candle close confirmed, retest held, volume behaved as expected, and a nearby structural level agrees with your read. If two of those four are missing, wait. For a deeper walkthrough on avoiding these traps, Trader Gibkey’s false breakout guide covers the pattern in more detail.
Channels, Multiple Trend Lines, and Advanced Uses
Once you can draw one reliable trend line, the next skill is drawing two. A parallel channel, built by copying your primary trend line and shifting it to touch the opposite swing points, gives you both an entry rail and a target rail in one structure.
In strong trends, you’ll often see a shallow primary line and a steeper interim line forming inside it during an acceleration phase. Treat that steeper line as a short-term guide, not gospel. When it breaks, that’s usually a hand-off back to the shallower primary line, not an outright reversal, so resist the urge to flip your entire bias on a steep-line break alone.
Trader Gibkey’s Practical Checklist and Example Workflow
After 18 years of trading price action live, the workflow that holds up is boring on purpose: identify the trend, draw the primary line off clean swing points, wait for a third touch or a confirmed close-and-retest break, cross-check a higher timeframe, then trigger, stop, size, and target in that order.
Copy this into your trading journal:
- Trend direction and timeframe drawn on
- Number of touches and slope estimate
- Trade type (bounce or break) and confirmation met
- Entry price, stop price, risk unit, position size
- Target and outcome, logged after the trade closes
That structured discipline is exactly what research on trend-line-based strategies suggests separates consistent traders from lucky ones.
When Trend Line Trading Fits Your Development
Trend lines suit traders who already have patience and can follow a stop without arguing with it. If you tend to move stops or chase entries, fix that first. The practice routine that works: backtest fifty examples by hand, run the rules on a demo account until they’re automatic, then journal every live trade against the checklist above.
— Gabriel
How Trader Gibkey Can Help You Trade This With Structure
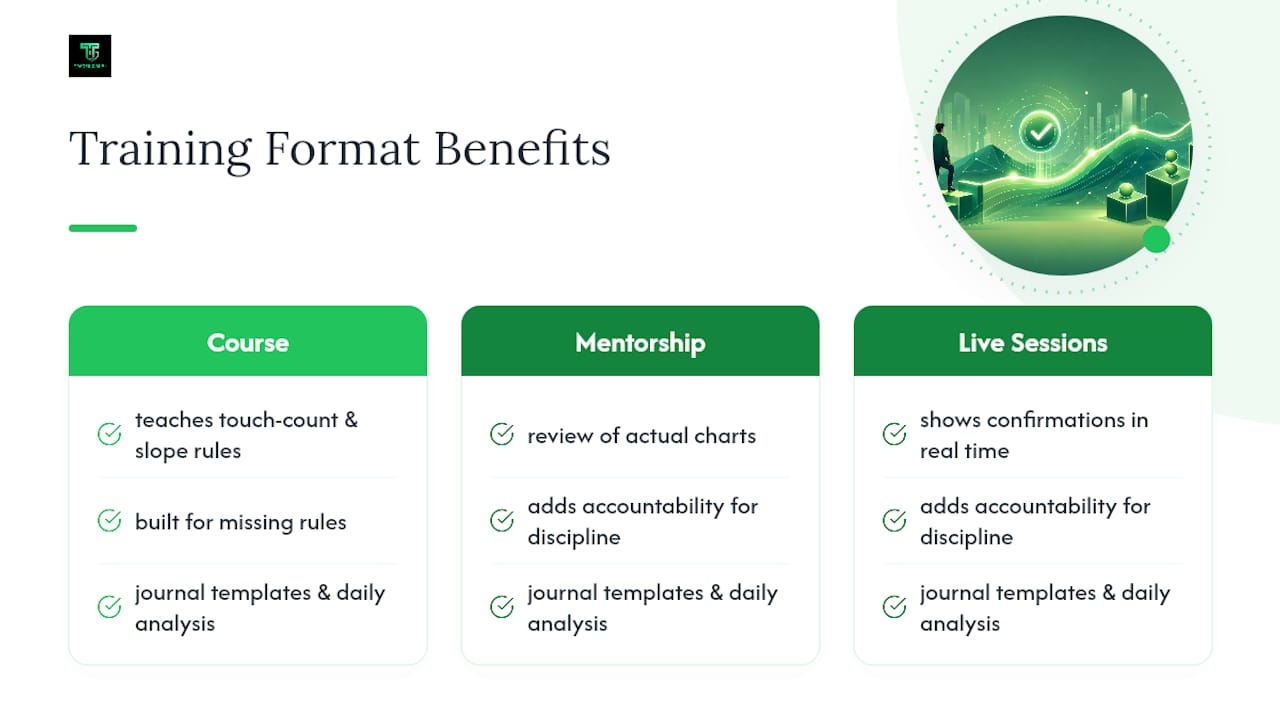
A structured approach can turn the checklist above into a repeatable habit instead of a one-time read. Educational courses often walk through drawing and trading trend lines with the same touch-count and slope rules covered here, mentorship sessions provide opportunities for review of actual charts, and live trading sessions can show the confirmation process happening in real time instead of in hindsight.

Before joining, ask yourself one honest question: are you missing rules, or are you missing the discipline to follow rules you already know? If it’s the first, the structured course path is built for that gap. If it’s the second, the mentorship and live sessions add the accountability a solo trader rarely builds alone. Either way, journal templates and daily market analysis are included so you’re not starting your practice routine from a blank page. Check the course and mentorship details on the Tradergibkey landing page and see which format matches where you’re at.
For sharpening your chart setup while you practice, a platform with solid multi-timeframe layouts helps enforce the higher-timeframe check covered earlier. The TradingView platform review is worth a look if you haven’t settled on your charting tool yet.
Sources
For drawing mechanics and validation rules, ChartSchool’s trend line reference is the clearest technical source available. For plain-language definitions and the case for combining trend lines with other signals, Investopedia’s trendline entry is a solid starting point. For practical break-and-retest examples, TradingWithRayner’s guide shows real chart cases worth studying against your own.
This article is general information, not a substitute for advice from a qualified financial advisor. Consult a qualified financial professional about your own circumstances before acting on anything here.