
The main support and resistance types are horizontal swing levels, trendlines and channels, moving averages, Fibonacci retracements, pivot points, psychological round numbers, and prior consolidation zones. The three trading methods worth mastering are bounce trading (range play), breakout trading (including the sweep or false break), and retest/polarity entries, each suited to a different type of level and market condition. None of this works if you treat a level as an exact price. Treat every level as a zone, a rough neighborhood where price has reacted before, and use it to frame your risk, not to predict the future.
Here’s the short version before we get into the mechanics:
- Bounce trading fits horizontal swing zones and psychological numbers in ranging markets.
- Breakout trading fits consolidation zones and trendlines once volume confirms a real move.
- Retest/polarity entries fit almost any level after it breaks, especially moving averages and pivot points.
- Confluence (multiple types stacking at one price) beats any single method used alone.
Pro Tip: Before you take any S/R trade, ask one question: “Would I still take this if I saw it on a chart with no indicators at all?” If the answer is no, you’re trading the tool, not the price.
Key Takeaways
Support and resistance work best when traded as zones with confirmation, not as exact lines predicting a reversal.
| Point | Details |
|---|---|
| Zones beat lines | Draw every level as a range spanning wicks and bodies, never a single price. |
| Match method to type | Use bounce trading in ranges, breakouts on consolidation, and retests after a level flips. |
| Confirmation before entry | Wait for a rejection candle, volume spike, or sweep reversal before committing capital. |
| Stops belong beyond the zone | Place stops past the far edge of the level or the sweep wick, not at its border. |
| Build the skill with structure | Trader Gibkey’s mentorship and live sessions turn these checklists into repeatable habits. |
Table of Contents
- What Types of Support Resistance Trading Methods Actually Mean
- The Main Types of Support and Resistance You’ll See on Any Chart
- How to Trade Support and Resistance: Three Core Methods
- How to Draw and Validate a Level Before You Risk Money
- Managing Stops, Targets, and Position Size Around S/R
- Common Mistakes Traders Make With Support and Resistance
- A Practitioner’s Checklist From Gabriel at Trader Gibkey
- Turn These Rules Into a Repeatable System
- Sources
- FAQ
What Types of Support Resistance Trading Methods Actually Mean
Support and resistance are price zones where buying or selling pressure has repeatedly shown up hard enough to pause or reverse a move. They form because orders cluster: stop losses, take profits, breakout entries, and institutional resting orders all pile up around the same rough price area. That’s what makes a “level” more of a shelf than a tripwire.
Here’s the part that trips up most new traders: a broken level doesn’t disappear. It flips. This is called polarity, or role reversal, and it’s one of the more reliable patterns in technical analysis. A swing low that gets broken often becomes resistance the next time price rallies back into it. That’s not a coincidence; it’s the same crowd of traders who bought that low now sitting on losing positions, itching to sell at breakeven.
So when a level breaks, don’t treat it as a failed setup. Treat it as new information about who’s in control.
- Zones, not lines. Draw a range, not a pixel.
- A break isn’t a failure of the level. It’s often the start of the next one.
- The first touch of any new level deserves suspicion, not action.
Pro Tip: When you draw a fresh level for the first time, assume it will get swept before it holds. Waiting for that sweep and the reaction after it filters out a huge number of bad entries.
The Main Types of Support and Resistance You’ll See on Any Chart
Every support resistance strategy starts with recognizing what kind of level you’re looking at, because the type dictates the method. Here’s the full catalogue, in the order most traders should learn to spot them.
Horizontal swing highs and lows. These are the most basic S/R type: a price area where the market has turned before, marked by clustering swing highs or lows. They form because traders who missed the first move place orders at the same price expecting a repeat reaction. On a 5-minute chart, a swing low means little. On a daily chart, the same structure carries real weight, since it reflects days or weeks of accumulated decisions rather than a few minutes of noise. Draw these as a zone spanning the wicks and the bodies of the reversal candles, not a single line through the exact low. Horizontal levels suit bounce trading in ranges and retest entries after a break.
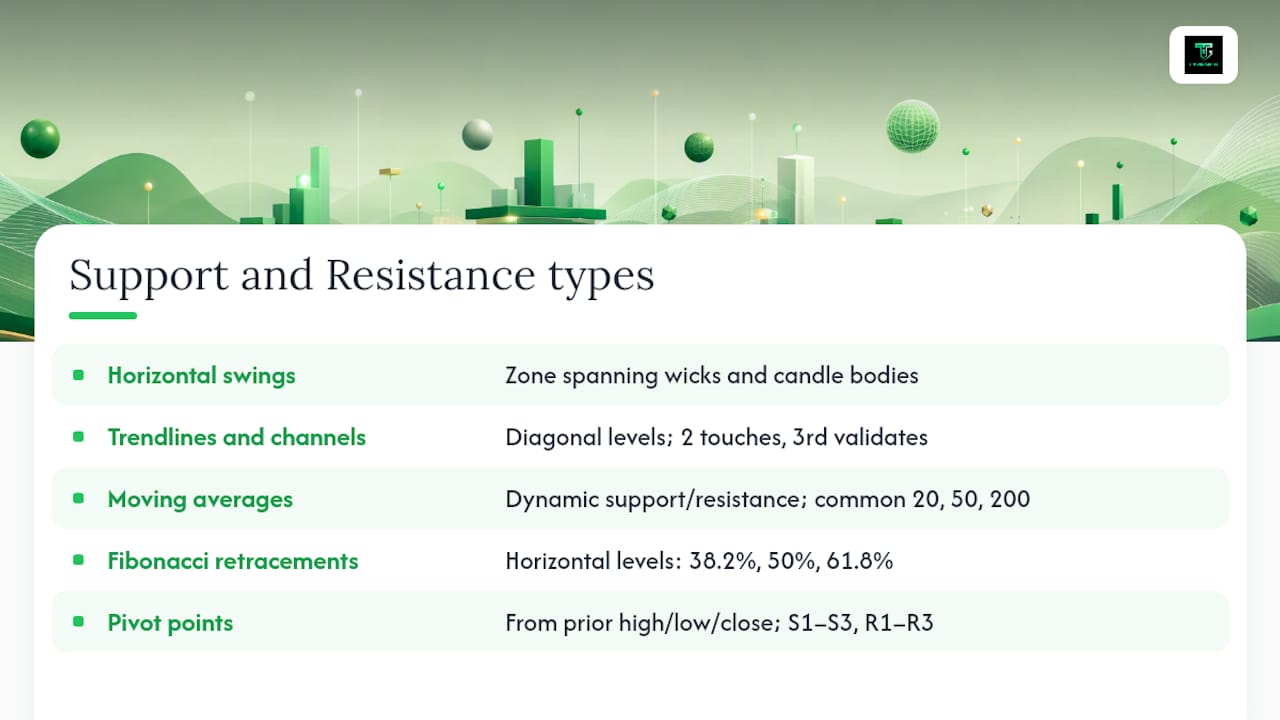
Trendlines and channels. These are diagonal support and resistance, connecting a series of higher lows in an uptrend or lower highs in a downtrend. They form because trend momentum keeps pushing entries at a steadily shifting price rather than a fixed one. A trendline needs at least two touches to exist and a third to be considered validated. Channels (a trendline plus a parallel line on the other side) give you both a bounce zone and a breakout zone in the same structure. These work best on swing and position timeframes, where trends have room to develop.

Moving averages and other dynamic support/resistance. Unlike fixed levels, moving averages act as support or resistance that shifts with price, most commonly the 20, 50, and 200-period lines. They form because so many traders watch the same averages that price genuinely reacts to them, a self-fulfilling mechanic as much as a mathematical one. The 200-day moving average carries outsized weight on daily charts for this exact reason. Dynamic S/R suits trending markets and works well for retest entries once price pulls back into a rising average.
Fibonacci retracements. These plot horizontal levels (commonly 38.2%, 50%, 61.8%) between a swing high and low, based on the idea that markets retrace a portion of a move before continuing. Common detection methods treat Fibonacci alongside swing points and trendlines as one of several interpretive tools, useful mainly when it lines up with another level type. Used alone, Fibonacci is weak. Stacked with a horizontal swing zone or a moving average, it earns its keep.
Pivot points (S1/S2/S3, R1/R2/R3). Calculated from the prior session’s high, low, and close, pivot points give intraday traders labeled reference levels for entries and exits. The central pivot marks the balance point; S1 and R1 are the first likely reaction zones, with S2/S3 and R2/R3 reserved for stronger trending moves. Day traders lean on these heavily because they reset daily and don’t require manual drawing, which matters when you’re watching five setups at once.
Psychological or round numbers. Prices ending in round figures, like 1.2000 on EUR/USD or 50,000 on Bitcoin, attract disproportionate attention simply because traders round their orders to clean numbers. This isn’t chart mechanics so much as crowd behavior, but the effect is measurable and repeats across almost every liquid market.
Prior consolidation and structure zones. These are ranges where price spent extended time building a base before breaking out, and they matter because that “time spent” reflects heavy order absorption. A breakout from consolidation, followed later by a retest of that same range, is one of the cleanest retest setups available. Volume that spikes at the moment of the break, confirming the level’s significance, separates a real breakout from a fakeout.
Confluence is where these types earn real trading weight. A round number sitting on top of a 200-period moving average, right where an old consolidation zone ended, is a far stronger reaction area than any single one of those levels alone.
How to Trade Support and Resistance: Three Core Methods
Once you can identify the type, you need a repeatable way to trade it. These three methods cover almost every legitimate support resistance strategy in circulation.
1. Bounce (range) trading. This works best in sideways markets, off horizontal zones, psychological numbers, or trendline touches within a channel.
- Entry: wait for a rejection candle (pin bar, engulfing) at the zone, not the first touch.
- Stop: just beyond the far edge of the zone, giving the level room to breathe.
- Target: the opposite side of the range, or the next major level, whichever comes first.
2. Breakout trading, including the sweep or false break. This suits consolidation zones and trendlines once momentum picks up. Professional traders often frame this differently than retail traders: instead of buying the first breakout candle, they wait for price to sweep through the zone, trapping the traders who chased the initial move, and enter on the confirmation reversal that follows.
- Entry: after a volume-backed close beyond the zone, or after a sweep and reversal confirmation on the execution timeframe.
- Stop: beyond the sweep wick or the far side of the broken structure.
- Target: measured move from the consolidation range, or the next significant level.
3. Retest and polarity entries. This is arguably the highest-quality setup type because a broken level flipping into new support or resistance gives you a defined risk point with trend already confirmed in your favor.
- Entry: on the retest of the broken zone, once a confirming candle forms in the direction of the break.
- Stop: back on the other side of the flipped zone.
- Target: the next structural level in the direction of the break.
Confirming signals worth waiting for across all three methods:
- A rejection wick or engulfing candle at the level, not just a touch.
- Volume expansion on the reaction, not a quiet drift through it.
- Alignment with the higher-timeframe trend rather than fighting it.
Avoid bounce trading against a strong trending market. Fading a level that’s being run over by momentum is one of the fastest ways to bleed an account. And avoid chasing breakouts without a pullback or sweep confirmation. Explosive first candles often exhaust before you even get filled.
Pro Tip: When a sweep happens, resist the urge to enter immediately. Wait for the confirmation candle on your execution timeframe. That patience is the entire method, not an optional extra step.
How to Draw and Validate a Level Before You Risk Money
Drawing S/R well is a skill most traders never formalize, and it shows in their results. Here’s a process that takes the guesswork out of it.
- Zoom out first. Pull up the daily or weekly chart before you touch anything on a lower timeframe.
- Mark the obvious swing highs and lows, the ones a stranger would circle without any explanation from you.
- Draw a zone spanning from the wick to the body of the reaction candles, never a single line.
- Check for multiple touches. Two or three reactions at the same rough price carry more weight than one.
- Check freshness. A level tested five times has likely absorbed most of its liquidity already and is weaker than a fresh one.
- Look for confluence: does a moving average, round number, or Fibonacci level land in the same zone?
Timeframe matters more than most traders admit. Intraday traders should anchor to the 15-minute and 1-hour charts but always check the 4-hour and daily for bias. Swing traders live mostly on the 4-hour and daily. Position traders should barely glance below the weekly.
Pro Tip: Run this 15-second check before entering: Is this level fresh? Does it align with the higher-timeframe trend? Does another type of S/R confirm it? If you can’t say yes to at least two, skip the trade.
Managing Stops, Targets, and Position Size Around S/R
Good levels mean nothing without disciplined trade management wrapped around them. Start with position sizing: risk a fixed portion of your account per trade. If your stop is 30 pips away and your account risk is $100, your position size is calculated to make that 30-pip move equal exactly $100, not a cent more.
- Place stops beyond the far side of the zone, not at its near edge, so normal noise doesn’t clip you out.
- On sweep entries, put the stop beyond the sweep wick itself, since that’s the actual invalidation point.
- Target the next meaningful zone rather than an arbitrary risk:reward multiple pulled from nowhere.
- Take partial profits at the first target and trail the remainder toward the next one.
- In trending markets, trail stops behind higher lows or lower highs. In ranging markets, take full profit at the opposite boundary instead of trailing, since ranges rarely extend the way trends do.
Review your risk-per-trade math regularly. It’s the one variable you fully control, even when the market isn’t cooperating.
Common Mistakes Traders Make With Support and Resistance
Most S/R losses trace back to a handful of repeated habits, not bad luck.
- Treating a level as a single price. Fix: always draw a zone with room for wicks.
- Ignoring the higher timeframe. Fix: check the daily bias before trusting a lower-timeframe reaction.
- Entering on the first touch. Fix: wait for a confirming candle or volume spike.
- Placing stops right at the zone’s edge. Fix: give the stop room beyond the far boundary.
- Ignoring liquidity sweeps. Fix: expect the sweep, then wait for the reversal confirmation instead of panicking out.
Levels are liquidity zones, not magic lines. The traders who lose most often fade a strong trend at resistance, trade a small timeframe without checking the bigger picture, or jump in on the very first touch with zero confirmation.
That pattern comes straight from how beginner mistakes get diagnosed in practice, and it lines up with what most experienced traders will tell you privately: the chart rarely fails you. The process around it usually does. Impulsive entries are a psychology problem wearing a technical-analysis costume.
A Practitioner’s Checklist From Gabriel at Trader Gibkey
Three templates worth memorizing:
- Bounce entry: rejection candle at a horizontal zone, stop beyond the zone, target the range’s far side.
- Retest/polarity entry: confirming candle on the retest of a broken level, stop on the other side of the flip, target the next structural zone.
- Sweep entry: wait for the false break to trap the crowd, enter on the reversal confirmation, stop beyond the sweep wick.
Before any of these, grade the level fast: is it aligned with the higher-timeframe trend, is it fresh, does something else confirm it, and is the risk actually acceptable for your account? If any answer is no, skip it.
Pro Tip: Log every S/R trade with the level type, the timeframe it formed on, your confirmation signal, and the outcome. Patterns in your own journal teach you faster than any chart ever will.
A Trader’s Take on What Actually Moves the Needle
The single habit that changed my results wasn’t a better indicator. It was slowing down at the level and demanding a reaction before acting. Most sessions reward patience; fast markets after a sweep reward quick, pre-planned execution instead. Knowing which mode you’re in, before price gets there, is the real edge.
Turn These Rules Into a Repeatable System
Knowing the types and methods is one thing. Executing them the same way, trade after trade, under real pressure, is what actually separates consistent traders from everyone else still guessing at the chart. That’s the gap Trader Gibkey’s structured training closes: live sessions where you watch these exact bounce, breakout, and retest setups called out in real time, mentorship that corrects your zone-drawing and stop placement before bad habits calcify, and template checklists that turn everything in this article into a repeatable process instead of a memory exercise.

If you’re ready to stop rebuilding your S/R rules from scratch every week, check the Trader Gibkey mentorship program and see which track, course, live sessions, or private community access, fits where you’re at right now.
Sources
For more on the mechanics behind these setups, Investing.com’s breakdown of support and resistance and Investopedia’s guide to S/R basics cover the foundational concepts well. For a deeper dive into how professionals trade sweeps and false breaks, Trading Strategy Guides’ zone-based approach is worth reading in full, and Saxo’s guide to finding support levels is useful if you want more detail on detection methods. If your focus is execution timing, start with multi-timeframe analysis next; if it’s psychology, read about common beginner mistakes instead.
This article is general information, not a substitute for advice from a qualified financial advisor. Consult a qualified financial professional about your own circumstances before acting on anything here.
- Investing
- Support and Resistance Basics
- How to Trade Support and Resistance Without Getting Stopped Out — Oyamori
- Support levels in trading: What they are and how traders use them | Saxo
FAQ
What’s the difference between a support/resistance zone and a line? A line marks one exact price. A zone accounts for the wicks and bodies around it, which is how price actually reacts.
What do S1, S2, R1, and R2 mean in pivot point trading? They’re calculated support and resistance levels from the prior session’s data, with S1/R1 as the first likely reaction points and S2/S3, R2/R3 reserved for stronger moves.
Which support resistance trading method works best for beginners? Retest and polarity entries tend to be the most forgiving, since the trend direction is already confirmed by the time you enter.