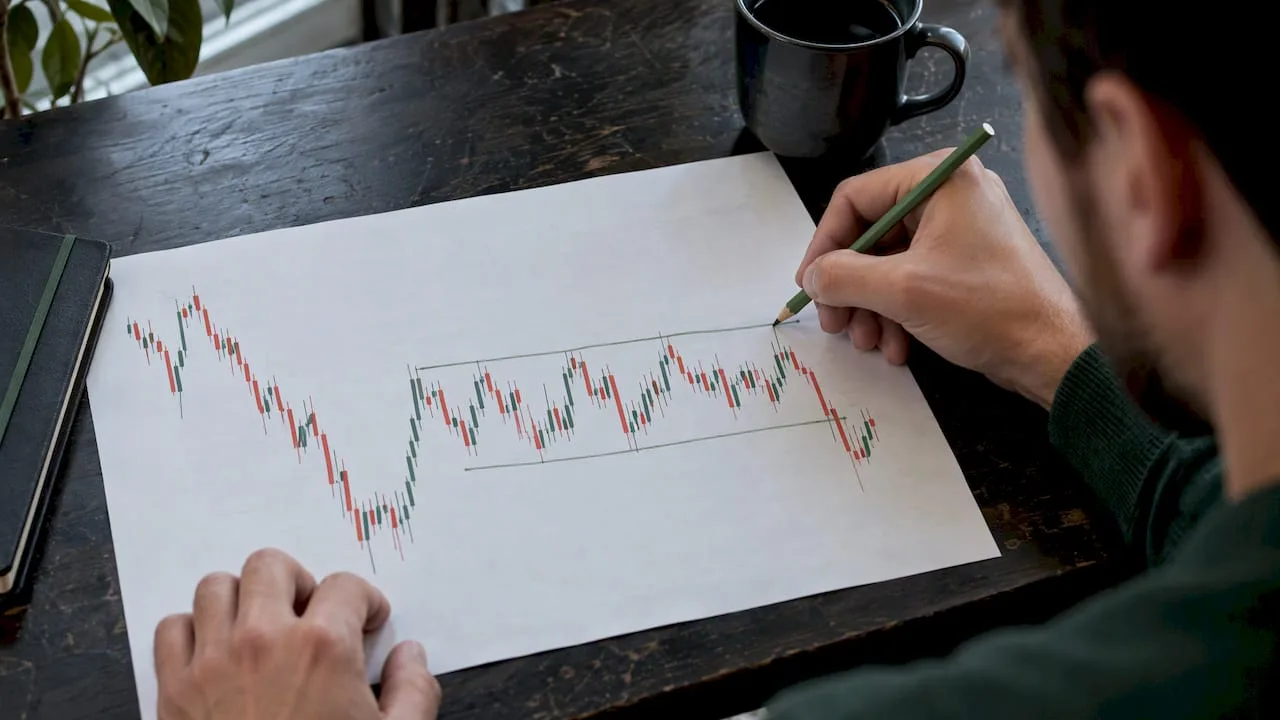
The Wyckoff method is a way of reading price as a story of supply and demand. Large players build positions inside a trading range, then price leaves that range and trends. In forex you can use it to spot those ranges, judge who is in control, and plan entries with a defined stop. The catch is that forex has no central exchange volume, so you adapt the method rather than copy it from a stock-market book.
This guide shows you how to do that, step by step, without the jargon pile-up.
TL;DR
- Wyckoff boils down to one idea: price moves in cycles of accumulation, markup, distribution and markdown, and the ranges between trends show who is in control.
- Learn the schematics as a map, not a script. Real charts rarely match them tick for tick.
- Forex volume is fragmented, so use tick volume as a rough guide and lean harder on price behavior: tests, springs, failed breaks.
- Wyckoff and SMC describe similar footprints in different vocabulary. Pick one language and stay consistent.
- Risk rules matter more than the pattern. Most retail leveraged traders lose money, so size every trade before you place it.
Table of Contents
- What the Wyckoff method actually says
- Wyckoff schematics in forex: accumulation and distribution
- The forex volume problem
- A simple Wyckoff workflow for a forex pair
- Wyckoff vs SMC
- Where Wyckoff goes wrong for retail traders
- A word on risk in the UK
- Our perspective: Wyckoff is a lens, not a system
- Build a structured path instead of collecting patterns
- FAQ
- Sources
What the Wyckoff method actually says
Richard Wyckoff was an early twentieth-century market operator who wrote down how professional money behaves. His ideas boil down to three laws: supply and demand, cause and effect, and effort versus result.
- Supply and demand: when demand exceeds supply, price rises. When supply wins, it falls. A range is a fight between the two.
- Cause and effect: the time spent building a range is the cause. The trend that follows is the effect. A long, tight range can fuel a bigger move than a short, sloppy one.
- Effort versus result: if a candle shows a lot of effort (large range, heavy activity) but little result (price goes nowhere), someone is absorbing the other side.
The market cycle that comes out of this has four stages: accumulation, markup, distribution and markdown. You trade the transitions, not the middle of the trend.
For real, this is why the method suits forex so well. Currency pairs spend a lot of time in ranges, and they often punish traders who chase breakouts inside them.
Wyckoff schematics in forex: accumulation and distribution
A schematic is a template of what a range often looks like before a trend. Here is the accumulation version, which sets up a move up. The event names are standard, and TLAP’s Wyckoff schematics reference lays out the phases A to E and the key events if you want a second view.
Accumulation, phase by phase
- Phase A, stopping the fall. Preliminary support (PS) shows the first sign of buying. The selling climax (SC) is a wide, emotional drop. An automatic rally (AR) follows and sets the top of the range. A secondary test (ST) retests the low.
- Phase B, building the cause. Price swings between the SC area and the AR high. Stronger hands absorb supply. Expect false breaks and a lot of noise.
- Phase C, the test. A spring dips under the range low, then snaps back inside. It is a trap for late sellers. Some ranges skip the spring and show a shallow higher low instead.
- Phase D, strength appears. A sign of strength (SOS) pushes toward the top of the range, followed by a last point of support (LPS), a higher low on a pullback.
- Phase E, markup. Price leaves the range and trends, with pullbacks that hold above old resistance.
Distribution is the mirror image
Distribution forms near highs. You will see a buying climax, an automatic reaction, an upthrust (a poke above the range that fails, often called UTAD when it comes late), a sign of weakness and a last point of supply. After that, markdown begins.
What to do with the schematic
Do not hunt for a perfect match. Use the schematic to ask three questions:
- Is price in a range or in a trend?
- Has one side tried to break out and failed?
- Is the latest test of a boundary weaker or stronger than the previous one?
If you can answer those, you can trade. If you cannot, stand aside.
The forex volume problem
Wyckoff built his method on stock tape and volume. Spot forex trades over the counter, so there is no single volume figure. Most retail platforms show tick volume, which counts price updates rather than traded contracts.
Is that useless? No. Tick volume tends to rise when activity rises, so it works as a rough proxy for effort. But it has limits, and this comparison of tick volume and real volume for forex traders explains why the two can differ and what to use when. Keep it simple:
- Treat tick volume as a hint, never as proof.
- Compare a bar’s volume with the bars around it, not with an absolute number.
- Give more weight to price: how far a candle travels, where it closes, and whether the next candle confirms it.
Sounds strange, but a clean read of candles often beats a messy volume read. Price action is the signal, volume is the supporting actor.
A simple Wyckoff workflow for a forex pair
Here is a process you can run on any liquid pair, such as GBP/USD or EUR/USD. It uses the four-hour chart for context and a lower timeframe for timing.
- Mark the trend and the range. On the four-hour chart, find the last strong move and the sideways area after it. Draw the range high and low. If you need help finding clean turning points, our price action workflow for swing highs and lows walks through it.
- Label the events you can see. Climax, rally, test. Skip any label you are not sure about. Fewer labels, fewer self-inflicted wounds.
- Look for Phase C behavior. A sweep beyond the range edge that closes back inside is your cue. Zoom into a lower timeframe and look for a shift in structure, such as a break of the last minor swing.
- Define the invalidation first. For a spring long, the stop sits below the spring low. If price makes a clean acceptance below it, the idea is wrong.
- Set the target. The opposite side of the range is a sensible first target. The next higher supply zone is the second. Our guide to reading supply and demand zones helps you place that.
- Size the trade last, with a hard rule. Decide your cash risk, then work out the position size from the stop distance, not the other way round.
A worked example
Suppose GBP/USD falls for several days, prints a wide-range selling climax, bounces, and then trades sideways for a week on the four-hour chart. Price dips under the range low, but the candle closes back inside the range on the next bar, and tick volume spikes on the dip then fades.
That is a possible spring. You would not buy blindly. You would wait for a lower-timeframe break of the last minor high, enter on the pullback, put the stop under the spring low, and aim first for the middle of the range, then its top. If the pair closes below the spring low, you are out for a small, planned loss.

The numbers here are illustrative, not a promise. Any setup can fail, which is why the stop comes first.
Wyckoff vs SMC
If you have watched any modern forex content, you have met SMC (smart money concepts). The two overlap a lot.
| Idea | Wyckoff term | Common SMC term |
|---|---|---|
| Sweep below a range low, then reversal | Spring or shakeout | Liquidity sweep |
| Poke above a range high, then failure | Upthrust (UTAD) | Buy-side liquidity grab |
| Break of a minor swing after the sweep | Sign of strength or weakness | Market structure shift |
| Pullback to a zone before the move | LPS or LPSY | Retest of an order block or fair value gap |
The difference is mostly framing. Wyckoff starts from the whole cycle and asks who is in control. SMC tends to start from the single sweep and the structure shift. If you want to see how a sweep, structure shift and fair value gap sequence plays out as a rule set you can test, this sweep, market structure shift and fair value gap strategy page is a useful starting point.
Our view: Wyckoff gives you the bigger picture, and the SMC vocabulary gives you precise entry language. Neither is magic. Use whichever you can apply consistently, and test it on your own charts.
Where Wyckoff goes wrong for retail traders
Most trouble comes from the same few habits.
- Forcing the pattern. You want a spring, so you see a spring. Count only what is on the chart.
- Trading every range. Small ranges inside noise do not carry cause. Look for ranges on higher timeframes with a clear prior trend.
- Ignoring news. A central bank decision can blow through any structure. Know the calendar before you hold a position.
- Moving the stop. The spring fails, you hope, and a small loss turns big. That is how a revenge trade starts: the brain stops trading the chart and starts trading the pain.
- Oversizing. A great read with a bad position size is still a bad trade.
On the last point, the one percent rule for UK forex traders and our broader risk management rules for new traders give you numbers you can adopt today.
A word on risk in the UK
This is education, not advice. Leveraged products are risky. The FCA reports that 82% of retail clients lose money on CFDs, and it describes rolling spot forex as complex and not generally suited to retail investors without a sophisticated understanding of the risks. That is no reason to quit. It is a reason to trade small, keep a journal, and treat the first year as tuition.
Also keep in mind that profits may have tax consequences. Our guides on how HMRC classifies forex profits and the UK forex tax rules are a good start, and a qualified tax adviser can confirm what applies to your situation.
Our perspective: Wyckoff is a lens, not a system
We have spent over 18 years in live markets, and the pattern we see in struggling traders is not a lack of knowledge. It is a pile of borrowed ideas that never turn into a repeatable process. Someone learns the schematics, then SMC, then a new indicator, and each time the old rules disappear when a losing streak starts.
Here is how we use Wyckoff:
- As context. It tells us whether a pair is being accumulated, distributed or simply drifting. That filters out a lot of bad trades.
- With price action for timing. Structure, rejection and failed breaks give us the entry, not a label from a diagram.
- With hard rules for risk. Cash risk per trade is fixed before the click. Our guide to cash-risk trade management shows the idea.
- With a journal. Every setup gets a screenshot, a reason and an outcome. After thirty trades, your own data tells you whether the spring setup suits you.
If you take one thing from this article, take this: decision quality beats pattern knowledge. You can be right about the schematic and still lose because you sized too big or moved a stop. You can be wrong on the label and still be fine because the rules held.
— Gabriel
Build a structured path instead of collecting patterns
If you would rather learn this with feedback than alone, we teach practical price action, risk management and trading psychology in a structured way. Our Price Action (Core) plan is £149 per month, and if you want one-to-one review of your charts, a single mentorship session is €149, with a 3-session pack at €399. You can see every option on the Trader Gibkey site.
FAQ
Does the Wyckoff method work in forex?
Yes, in an adapted form. Ranges, tests and failed breaks show up in currency pairs, but volume is only a proxy, so lean on price behavior.
What is the difference between Wyckoff and SMC?
They describe similar footprints. Wyckoff frames the whole cycle of accumulation and distribution, while SMC focuses on liquidity sweeps and structure shifts.
Which timeframe is best for Wyckoff schematics?
Use the four-hour or daily chart for the range and a lower timeframe for entry. Ranges on higher timeframes carry more weight.
Sources
- FCA, CP16/40 infographic on contracts for differences
- TLAP, Wyckoff schematics: accumulation and distribution