
ICT (Inner Circle Trader) and SMC (Smart Money Concepts) are not competing systems. ICT is a more formalized, time-aware layer built on top of SMC’s structural foundation. If you already trade SMC, you are already using most of ICT’s core vocabulary. The practical question is not which one to pick but when to add ICT’s timing rules and whether they fit your schedule and markets.
The recommended path is direct: build price-action fundamentals first, then layer SMC structure, then add ICT selectively for session-timed entries. Skipping that sequence is the single most common reason traders get confused by both frameworks. SMC’s effectiveness depends on a price-action foundation and disciplined execution, not on how many labels you can draw on a chart.
The hybrid rule that works in practice: use SMC to grade your zone, then use an ICT Kill Zone to time your entry. Both gates must pass. This single rule, applied consistently, is worth more than memorizing every ICT model name.
Key Takeaways
ICT and SMC share the same foundational signals; the hybrid approach of using SMC for zone quality and ICT Kill Zones for timing produces fewer but higher-probability setups when both gates are applied without exception.
| Point | Details |
|---|---|
| Study sequence matters | Learn price action first, then SMC structure, then add ICT timing selectively. |
| Hybrid requires hard gates | SMC zone quality + ICT Kill Zone + LTF confirmation must all pass; two out of three is not the system. |
| Risk management is the edge | Position sizing and structural stops outperform any label system; enforce 1% risk and 2:1 R:R minimum. |
| Journal every trade | Without a journal, you cannot separate a bad setup from bad luck or measure real progress. |
| Test before scaling | Run 20 forward-test trades on any new rule before applying it to live capital. |
Table of Contents
- How do ICT and SMC trading compare side by side?
- What is ICT trading and how does it work?
- What is SMC trading and how do you apply it?
- What technical concepts do ICT and SMC share?
- How do you execute a trade using ICT or SMC?
- How do you combine ICT and SMC into one hybrid approach?
- Common mistakes traders make learning ICT and SMC
- What learning path does Tradergibkey recommend for ICT and SMC?
- A study and practice plan over several weeks can be followed to learn these concepts effectively.
- The label is not the edge
- Sources
- FAQ
How do ICT and SMC trading compare side by side?
The table below maps the six dimensions that actually determine whether a framework fits your trading life.
| Dimension | ICT | SMC |
|---|---|---|
| Primary focus/edge | Session-timed institutional entries | Structural zone quality and institutional footprints |
| Core signals | FVG, Kill Zones, MSS, AMD/Judas Swing, PD arrays | Order blocks, FVGs, BOS/CHoCH, liquidity sweeps |
| Typical timeframes | 1m–15m intraday during Kill Zones | 15m–4H swing; flexible across timeframes |
| Trade cadence | Lower frequency; strict time windows reduce setups | Moderate frequency; zone-based, less time-restricted |
| Entry/stop conventions | Entry at FVG or OB inside Kill Zone; stop below/above MSS | Entry at confirmed OB or FVG; stop below/above structure |
| Best for | Intraday forex/index traders with fixed session hours | Swing traders, multi-market traders, beginners building structure skills |
When to prefer ICT:
- You trade forex or U.S. equity indices and can be at your desk during the London open (2:00–5:00 AM EST) or New York open (7:00–10:00 AM EST).
- You want a strict, procedural entry model with named sequences (Silver Bullet, Turtle Soup) that removes discretion.
- You already understand SMC structure and want to sharpen intraday timing.
When to prefer SMC:
- You swing trade or cannot commit to fixed session windows.
- You trade crypto, commodities, or multiple asset classes where ICT’s forex-centric timing does not map cleanly.
- You are building your structural reading skills and need a flexible, asset-agnostic vocabulary first.
What is ICT trading and how does it work?
ICT stands for Inner Circle Trader, the methodology developed by Michael Huddleston. The framework models how institutional participants accumulate and distribute positions, then uses that model to time entries with precision. ICT emphasizes strict session timing and formal entry models, treating Fair Value Gaps and order blocks with procedural rules tied to specific Kill Zones.
Core ICT signals and models:
- Fair Value Gap (FVG): A three-candle imbalance where the wicks of the first and third candles do not overlap, leaving an unfilled price range that institutions may revisit.
- Kill Zones: Defined time windows (London open, New York open, London close) when institutional order flow is highest and setups carry the most weight.
- AMD (Accumulation, Manipulation, Distribution): The three-phase model describing how price sweeps liquidity before the real directional move. The manipulation phase is often called the Judas Swing.
- Market Structure Shift (MSS): A lower-timeframe structural break that confirms the directional move has begun, used as the entry trigger inside a Kill Zone.
- Named models: Silver Bullet (a 10:00–11:00 AM EST FVG entry sequence) and Turtle Soup (a stop-hunt reversal at a prior swing) are two of the most widely studied ICT setups.
ICT builds on SMC’s foundation and adds terminology and timing layers, such as FVG filters and Kill Zones. Many ICT concept names map directly to SMC labels, which is why traders who learn SMC first tend to absorb ICT faster.
Pro Tip: To test a Kill Zone rule without overfitting, pick one session window (e.g., New York open 7:00–10:00 AM EST) and one pair (e.g., EUR/USD). Mark every FVG that forms during that window for 20 consecutive trading days. Count how many times price returns to the FVG and how many produce a clean MSS. Twenty samples is a minimum; forty is better. Do not adjust the rule mid-test.
What is SMC trading and how do you apply it?
Smart Money Concepts is a structural, asset-agnostic approach to reading institutional footprints in price. It does not belong to a single creator the way ICT belongs to Michael Huddleston. Instead, SMC emerged as a community-driven vocabulary that systematized concepts already present in Wyckoff analysis and classical price action.
SMC works as a three-gate workflow: establish the higher-timeframe (HTF) trend, identify a high-probability zone (order block, FVG, or liquidity sweep area), then wait for a lower-timeframe confirmation trigger such as a CHoCH or MSS before entering.
Core SMC concepts in practice:
- Order block (OB): The last opposing candle before a strong impulsive move. Price often returns to this zone for reactive entries.
- Break of Structure (BOS): A confirmed continuation of the current trend, used to maintain directional bias.
- Change of Character (CHoCH): A structural reversal signal on a lower timeframe, used as a confirmation trigger.
- Liquidity runs: Price sweeps above prior highs or below prior lows to collect stop orders before reversing. Identifying these sweeps tells you where institutional orders were filled.
- FVGs in SMC: Used as magnets and reactive zones, similar to ICT but without the strict Kill Zone time filter.
SMC is preferable when you swing trade, work across multiple markets, or are still building your structural reading skills. The framework is flexible enough to apply to forex, crypto, and large-cap equities, though session structure and timing rules must be adapted per asset class. Forex most closely matches the original ICT assumptions because it has defined institutional sessions.
For a step-by-step SMC beginner’s primer covering order blocks, FVGs, and BOS/CHoCH in detail, Tradergibkey’s dedicated guide is a practical starting point.
What technical concepts do ICT and SMC share?
Both frameworks use the same underlying signals. The difference is in how each framework names, grades, and times them.
| Concept | Definition | ICT treatment | SMC treatment | Quality checklist |
|---|---|---|---|---|
| Order Block (OB) | Last opposing candle before an impulsive move | Must align with a PD array; graded by session context | Graded by HTF trend alignment and displacement strength | Strong displacement candle? HTF trend aligned? Unmitigated? |
| Fair Value Gap (FVG) | Three-candle imbalance with no wick overlap | Filtered by Kill Zone timing; used as entry or target | Used as magnet and reactive zone without time filter | Gap size relative to ATR? Fresh (unvisited)? Inside a POI? |
| BOS / CHoCH | BOS = trend continuation; CHoCH = reversal signal | CHoCH on LTF confirms MSS for entry trigger | CHoCH used as confirmation gate in three-gate workflow | Occurs after a liquidity sweep? Clean candle close? |
| Liquidity sweep / Judas Swing | Stop-hunt move above/below prior swing before reversal | Named Judas Swing in AMD model; precedes distribution | Called a liquidity run or stop hunt; precedes OB reaction | Sweep of obvious swing high/low? Followed by strong rejection? |
| Breaker / Mitigation block | A failed OB that price breaks through, then returns to | Called a breaker block; used as a bearish/bullish flip zone | Called a mitigation block; same structural logic | Prior OB broken with displacement? Price returning for first time? |
Pro Tip: The single fastest way to cut false positives on order blocks is to require a displacement candle after the OB forms. If price leaves the OB zone without a strong, full-bodied candle closing beyond the prior swing, the OB is weak. Drop it. A practitioner-developed FVG filter: on a 1-hour chart, if an FVG is left unfilled within roughly six hours of formation, treat it as “fresh” when price returns. This is a trader-developed heuristic, not an official ICT rulebook clause, but it reduces reactive entries into stale gaps.
How do you execute a trade using ICT or SMC?
Theory is only worth what you can execute. Here is a repeatable workflow that works for both frameworks.
Step-by-step trade checklist:
- Establish HTF bias. On the daily or 4H chart, identify the current BOS direction. Mark the last significant swing high and low. Your trades should align with this bias.
- Identify your Point of Interest (POI). Mark unmitigated order blocks, fresh FVGs, and liquidity pools on the 1H or 4H chart. These are your zones, not your entries.
- Wait for price to reach the POI. Do not enter at the zone boundary. Let price enter the zone and show a reaction.
- Confirm on the lower timeframe. Drop to the 5m or 15m chart. Wait for a CHoCH or MSS that confirms the reversal inside the zone.
- Execute the entry. Enter at the open of the confirmation candle or at the FVG left by the MSS move.
- Place your stop. Stop goes below the lowest wick of the OB (for longs) or above the highest wick (for shorts). Never place it inside the zone.
- Calculate position size. Risk 0.5%–1% of account per trade. Divide your dollar risk by the stop distance in pips/points to get your lot size.
- Set your target. Aim for the next liquidity pool, prior swing high/low, or a 2:1 minimum risk-to-reward ratio.
SMC swing trade walkthrough (EUR/USD, 4H): Price is in a bullish BOS sequence on the daily. On the 4H, a clean bullish OB sits at 1.0820, left by a strong displacement candle. Price sweeps the prior swing low (liquidity run) and enters the OB. On the 1H, a CHoCH forms at 1.0835. Entry at 1.0840, stop at 1.0805 (below OB low), target at 1.0920 (prior 4H high). Risk-to-reward: approximately 2.3:1.
ICT intraday walkthrough (NQ futures, 5m): During the New York open Kill Zone (7:00–10:00 AM EST), price sweeps the overnight high (Judas Swing). A bearish FVG forms on the 5m chart at 18,450–18,470. Price returns to the FVG at 9:15 AM EST. A 1m MSS confirms bearish intent. Entry at 18,455, stop at 18,475 (above FVG high), target at 18,380 (prior liquidity low). Kill Zone timing is the gate that qualifies this setup.
Minimal trade journal template:
- Date and session
- Asset and timeframe
- HTF bias (bullish/bearish)
- POI type (OB, FVG, liquidity sweep)
- Entry price, stop price, target price
- Risk % and lot size
- Outcome (R gained or lost)
- What the setup looked like vs. what you expected
- One lesson or observation
Risk management checklist for zone-to-target setups:
- Risk no more than 1% per trade
- Stop is structural (below/above OB), never arbitrary
- Minimum 2:1 R:R before entry
- No entry without a confirmed LTF trigger
- Position sizing rules calculated before order placement, not after
How do you combine ICT and SMC into one hybrid approach?
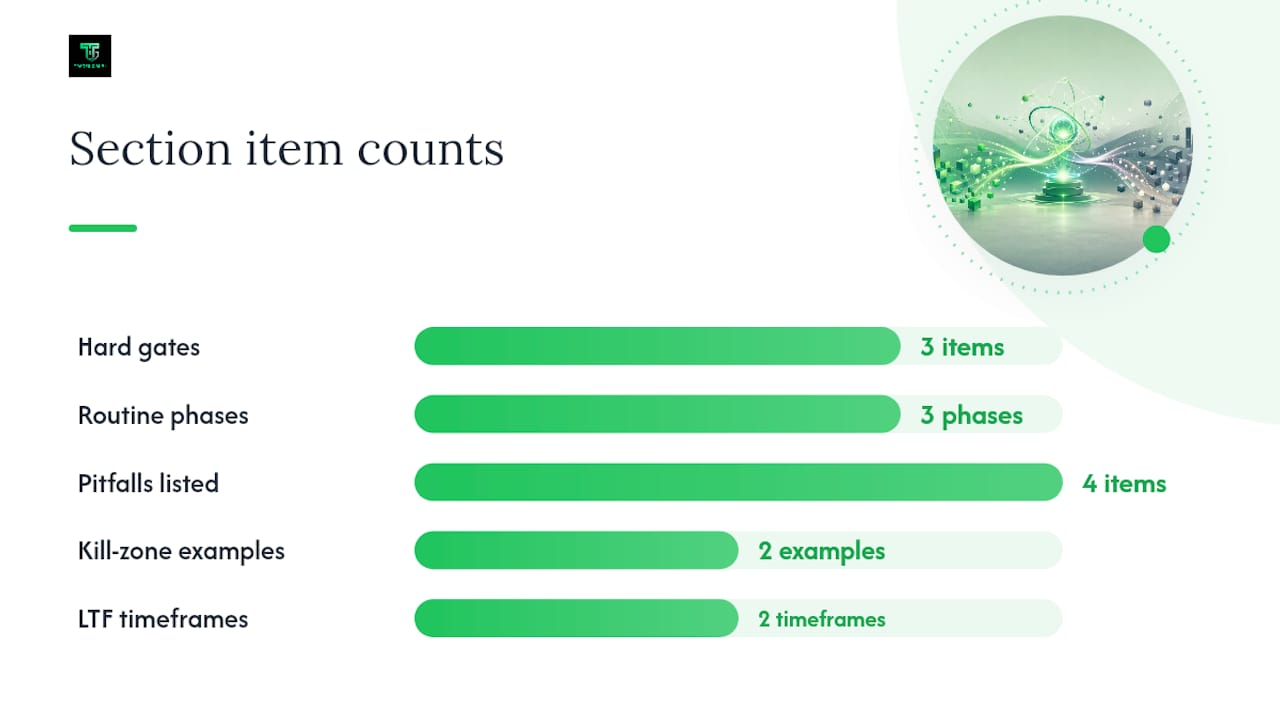
Combining SMC structural filters with ICT time filters produces a hybrid that yields fewer but higher-probability setups when both rule-sets are applied strictly. The key word is strictly. Mixing labels without hard gates is not a hybrid; it is discretionary guessing with extra vocabulary.
The hybrid rule-set (three hard gates):
- Gate 1 (SMC structure): HTF trend is confirmed by BOS. A high-quality, unmitigated OB or FVG exists in the trend direction. The zone has a displacement candle behind it.
- Gate 2 (ICT timing): Price reaches the zone during a Kill Zone window (London open or New York open). No Kill Zone active = no entry, regardless of how good the zone looks.
- Gate 3 (LTF confirmation): A 5m or 1m MSS/CHoCH forms inside the zone during the Kill Zone. All three gates must pass. One failure = no trade.
Sample daily routine:
- Pre-session (30 minutes before Kill Zone): Mark HTF bias on daily/4H. Identify and grade all unmitigated OBs and FVGs. Note liquidity pools above and below.
- During Kill Zone: Watch for price to enter a marked zone. Do not mark new zones in real time. Wait for Gate 3 confirmation.
- Post-session: Journal the outcome. Note whether any gate was borderline and what you would do differently.
Pitfalls when mixing ICT and SMC:
- Inconsistent gate application. Taking a trade because two of three gates pass is not the hybrid system. It is the old system with new labels.
- Over-filtering. Adding too many confluence requirements (HTF OB + FVG + Kill Zone + MSS + volume + news filter) reduces setups to near zero. Three gates is enough.
- Under-sampling. Judging the hybrid after five trades is statistically meaningless. Commit to 30 trades minimum before evaluating.
- Mixing asset-class timing without adjustment. ICT Kill Zones are built for forex and U.S. equity indices. For crypto, many practitioners anchor to the U.S. equity open at 9:30 AM EST because crypto lacks a natural institutional session structure.
Common mistakes traders make learning ICT and SMC
Most of the pain in learning these frameworks comes from a handful of repeatable errors. Here is what they are and how to fix them.
- Jumping to ICT before price-action basics. If you cannot read a swing high/low or identify a trend on a clean chart, ICT’s named models will confuse you. Master structure and candle reading first. Fix: spend two weeks on a naked chart before adding any SMC or ICT labels.
- Over-labeling the chart. Drawing every possible OB, FVG, and liquidity pool creates visual noise and decision paralysis. Fix: mark only the two or three highest-quality zones per session, graded by the checklist in Section 5.
- Ignoring HTF bias. Taking a bullish LTF setup against a bearish daily trend is one of the most common losing patterns. Fix: write your HTF bias at the top of your journal entry before you look at any lower timeframe.
- Incorrect stop placement. Placing stops inside the OB instead of below its wick turns a structural stop into a random one. Fix: stop goes below the lowest wick of the OB, always.
- Misapplying Kill Zones across markets. ICT’s London and New York windows are calibrated for forex. Applying them unchanged to crypto or commodities produces false signals. Fix: adapt timing to the asset’s actual liquidity peak, or use SMC without time filters for non-forex markets.
- No journaling. Without a journal, you cannot distinguish a bad setup from bad luck. Fix: use the minimal template from Section 6 after every single trade.
Pro Tip: Before adding a new rule to your live system, run it on 20 forward-test trades in a demo account. Not a backtest. A forward test, in real time, with real decision pressure. Backtesting is useful for initial screening, but it cannot replicate the emotional weight of a live entry. Twenty forward samples will tell you whether the rule holds under real conditions. If you want guidance on recognizing when a system is genuinely broken versus just in a drawdown, that distinction matters for knowing when to iterate versus when to stop.
What learning path does Tradergibkey recommend for ICT and SMC?
The sequence matters more than the speed. Here is the path Tradergibkey recommends, with realistic time estimates based on consistent screen time.
Stage 1: Price action foundation (weeks 1–4) Learn to read market structure (swing highs/lows, trend, consolidation) on a naked chart. Study candlestick behavior at key levels. Goal: identify a trend and a key level without any indicators. Milestone: you can mark the last three significant swing highs and lows on a daily chart in under two minutes.
Stage 2: SMC structure (weeks 5–8) Add order blocks, FVGs, BOS/CHoCH, and liquidity pools. Apply the three-gate SMC workflow (HTF bias → POI → confirmation). Backtest 30 setups on historical data. Milestone: you can grade an OB as high or low quality using the checklist from Section 5 without hesitation.
Stage 3: Selective ICT (weeks 9–12) Add Kill Zone timing to your best SMC setups. Study one ICT model (Silver Bullet or AMD) in depth before adding others. Forward-test 20 setups with the hybrid rule-set. Milestone: you can execute the three-gate hybrid without second-guessing Gate 2.
The Tradergibkey community and structured courses support each stage with live sessions, daily analysis, and direct mentorship. That kind of structured accountability compresses the learning curve significantly compared to self-study alone.
Pro Tip: When you start converting paper trade wins into a live scale plan, track three metrics before increasing size: win rate over the last 30 trades, average R:R, and maximum consecutive losses. If your win rate is above 40% and your average R:R is above 2:1, your expectancy is positive. Do not increase size during a drawdown. Increase size only after a 30-trade block confirms the metrics hold.
A study and practice plan over several weeks can be followed to learn these concepts effectively.
This plan assumes one to two hours of screen time per day. Adjust the pace to your schedule, but do not skip the journaling step.
Week 1: Structure and bias
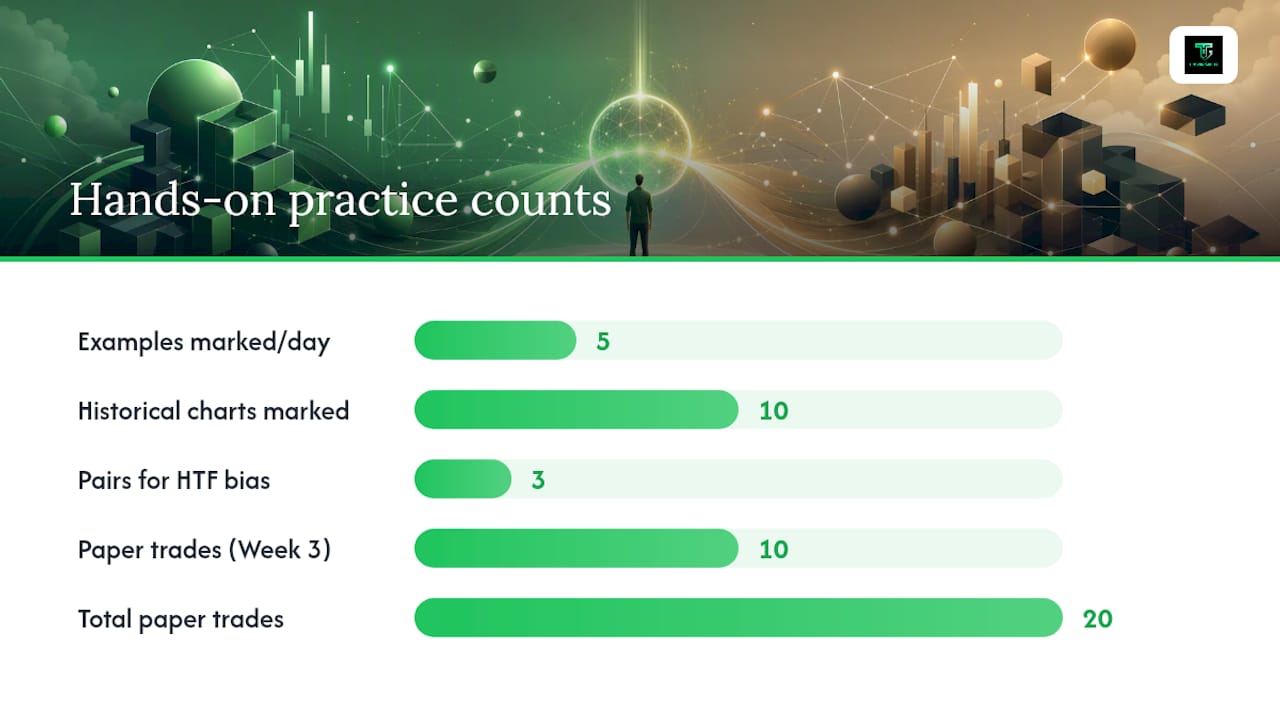
- Day 1–2: Study swing highs/lows and trend identification on daily charts. Mark five historical examples per day.
- Day 3–4: Add BOS and CHoCH identification. Mark where structure shifted on 10 historical charts.
- Day 5–7: Practice marking HTF bias on live charts (daily and 4H) for three pairs. Journal your bias each morning before the session.
Week 2: Zones and POIs
- Day 8–10: Identify and grade order blocks on 4H charts. Use the displacement-candle requirement from Section 5.
- Day 11–12: Add FVG identification. Apply the six-hour freshness filter on 1H charts.
- Day 13–14: Mark liquidity pools (prior swing highs/lows) and note where price sweeps them. Journal each observation.
Week 3: Confirmation and execution
- Day 15–17: Practice the full SMC three-gate workflow on historical setups. Log each gate pass/fail.
- Day 18–19: Add LTF CHoCH/MSS confirmation. Practice dropping from 4H to 15m for the trigger.
- Day 20–21: Execute 10 paper trades using the full workflow. Record entry, stop, target, and outcome in your journal.
Week 4: ICT timing and hybrid testing
- Day 22–24: Study Kill Zone windows. Mark which of your Week 3 setups would have qualified under Kill Zone timing.
- Day 25–27: Apply the three-gate hybrid rule-set to 10 forward-test paper trades during live Kill Zone windows.
- Day 28–30: Weekly review. Calculate win rate, average R:R, and expectancy across all 20 paper trades. Identify the one gate that failed most often and adjust your grading criteria.
Performance metrics to track:
- Win rate (target: above 40% for a 2:1 R:R system)
- Average R:R per trade
- Expectancy (win rate × avg win R minus loss rate × avg loss R)
- Maximum consecutive losses (tells you whether your drawdown tolerance is realistic)
Weekly review structure: Every Sunday, review your journal entries. Ask three questions: Which gate failed most? Was the HTF bias correct at entry? Did I follow the checklist without deviation? Modify the study plan based on the answers, not on whether you made money that week.
The label is not the edge
Here is the honest take: most traders who struggle with ICT and SMC are not struggling with the concepts. They are struggling with execution discipline and the temptation to keep adding complexity.
The conventional advice is to learn more models, more confluences, more named setups. That is the wrong direction. The traders who actually perform consistently with these frameworks tend to use fewer signals, not more. They pick one or two high-quality zones per session, apply a hard rule-set, and journal obsessively. The label on the zone (OB vs. PD array vs. supply zone) matters far less than whether the zone is fresh, aligned with HTF bias, and confirmed on a lower timeframe.
What gets underestimated is the psychological cost of a complex system. When you have twelve confluence requirements, you will always find a reason to take a trade that does not fully qualify, because something always lines up. A three-gate rule-set forces clarity. Either all three pass or you sit on your hands. That discipline, not the vocabulary, is where the edge lives.
The learning sequence (price action → SMC → selective ICT) is not arbitrary. It mirrors how institutional logic actually builds: structure first, zones second, timing third. Reversing that order is like learning to read a map before you understand what a road is.
If you are going to prioritize one thing from this article, make it the journal. Not the hybrid rule-set, not the Kill Zone windows. The journal. It is the only tool that converts screen time into actual skill, and it is the one thing most traders skip.
This article is general information, not a substitute for advice from a qualified financial advisor. Consult a qualified financial professional about your own circumstances before acting on anything here.
Sources
- Day 18: ICT & SMC On Forex, Crypto & Stocks — Key Differences Explained | Trading Strategy Guides
FAQ
Is ICT the same as SMC? No. ICT is built on SMC’s foundation and adds strict session timing (Kill Zones) and formal entry models. SMC is the broader structural vocabulary; ICT is a more procedural, time-filtered layer on top of it.
Which should I learn first, ICT or SMC? Learn price action basics first, then SMC structure, then add ICT timing selectively. Jumping straight to ICT without SMC or price-action foundations increases confusion significantly.
Can I use ICT strategies on crypto? Yes, but ICT’s Kill Zone timing must be adapted. Many practitioners anchor intraday crypto timing to the U.S. equity open at 9:30 AM EST because crypto lacks a defined institutional session structure.