
Use a fixed 3-timeframe stack — context (HTF), signal (MTF), execution (LTF) — with adjacent timeframes spaced 4–6x apart, and trade only when alignment supports your bias. That’s the whole game. Everything else is refinement. Three timeframes are the practical sweet spot for most retail traders: fewer leaves critical gaps; more creates analysis paralysis that costs you real money. The three rules that make it work: HTF defines your bias and you never trade against it without extra confirmation; the signal timeframe qualifies the setup; the execution timeframe times the entry and tightens the stop. Wyckoff’s market-cycle thinking maps cleanly onto this structure — accumulation and distribution phases show up on the HTF, while the signal and execution frames reveal where the cycle is playing out right now. According to Investopedia, higher timeframes take precedence, and when HTF and LTF conflict, the right move is to pause and reassess rather than force a trade.
Table of Contents
- Which timeframes fit your trading style?
- Top-down vs. bottom-up: which approach should you use?
- How to confirm entries, set stops, and size positions across timeframes
- What to do when your timeframes disagree
- Five high-edge multi-timeframe strategies you can run now
- The most common multi-timeframe mistakes and how to fix them
- Mentor-annotated trade examples from Tradergibkey
- Key Takeaways
- The discipline gap nobody talks about
- Tradergibkey’s structured path to mastering multi-timeframe trading
- Useful sources and further reading
- FAQ
Which timeframes fit your trading style?
The right stack depends on how long you hold trades and how much screen time you have. Institutional top-down workflows consistently use HTF for bias, mid TF for setups, and LTF for precise execution — and the HTF bias is treated as the largest source of edge, not the entry pattern.
The 4–6x spacing rule is the practical standard: adjacent timeframes should be roughly 4–6 times apart. Too close (e.g., M5 and M10) and you’re reading the same noise twice. Too wide (e.g., Monthly and M15) and you lose the connective tissue between bias and entry.
| Trading Style | HTF (Context) | Signal TF | Execution TF | Typical Hold Time |
|---|---|---|---|---|
| Scalping | H1 | M15 | M5 | Minutes |
| Day Trading | H4 | H1 | M15 | Hours |
| Swing Trading | Daily | H4 | H1 | Days |
| Position Trading | Weekly | Daily | H4 | Weeks to months |
- — on H4→H1→M15 benefit from marking H4 levels the night before so the session starts with a clear bias already in place.
Pro Tip: When a major news event or a session transition changes volatility significantly, shift your execution TF one step higher temporarily. During thin Asian session hours, an M5 execution frame becomes unreliable; M15 gives you cleaner structure. Understanding session overlap dynamics helps you make that call with confidence rather than guesswork.
Top-down vs. bottom-up: which approach should you use?
Most traders should default to top-down. Start with the HTF, establish bias, then work down to find setups. Top-down multi-timeframe analysis prevents single-timeframe mistakes — a bullish engulfing candle on M15 looks compelling until you check the H4 and realize price is in the middle of a strong downtrend. That’s not an entry; that’s a trap.
Top-down approach:
- Starts with HTF bias, then filters setups on lower TFs
- Reduces false signals by anchoring every entry to a larger structural context
- Best for: most Forex and stock traders, especially those with defined sessions and a clear daily routine
- Main risk: confirmation bias — you find the HTF bias first, then unconsciously cherry-pick LTF signals that match it
Bottom-up approach:
- Spots a compelling LTF setup first, then checks HTF for confirmation
- Faster for opportunistic scalps where speed matters more than full context
- Best for: experienced traders in market-making or range-bound environments where the HTF is neutral
- Main risk: higher susceptibility to noise; LTF setups that look clean often fail when HTF structure is against them
The honest answer is that bottom-up works best as a secondary filter, not a primary method. Use it when the HTF is genuinely ranging and you’re looking for LTF reversals inside that range. Outside of that context, top-down is the more reliable default. New traders who start bottom-up tend to develop what you might call short-term noise addiction — they drill into lower TFs, the signal-to-noise ratio degrades, and they start overtrading.
How to confirm entries, set stops, and size positions across timeframes
Entry confirmation requires two things: a valid signal TF setup near an HTF POI, and an execution TF trigger that confirms the move has started. A signal TF setup without an execution TF trigger is a reason to watch, not a reason to enter. An execution TF trigger without a signal TF setup is noise.
Entry rules:
- Signal TF must show a break of structure or a clear rejection at the HTF POI
- Execution TF must show a micro-structure shift (lower high broken to the upside in a long, or higher low broken to the downside in a short)
- Both conditions must be present before size goes on
Stop placement:
- Aggressive stops: below the execution TF micro-structure (tighter, higher R:R, more likely to be stopped out on normal noise)
- Conservative stops: below the HTF structural level (wider, lower R:R, more room for the trade to breathe)
- The choice depends on your account size and risk tolerance, but the stop must always sit at a point that genuinely invalidates the trade thesis
Position sizing by alignment:
- Full alignment (HTF + signal TF + execution TF all agree): standard risk per trade
- Partial alignment (two of three agree): reduce size by 30–50%
- Counter-alignment (HTF opposes the trade direction): skip the trade or require a very high-quality execution TF signal with reduced size
Risk reminder: Partial exits are a practical tool when multiple timeframes provide staged targets. Take a portion off at the signal TF target and let the remainder run to the HTF target. This locks in profit while keeping exposure to the larger move.
Pyramiding into a position works when HTF and signal TF alignment is strong and price has already moved in your favor. Add only on pullbacks that hold above the execution TF structure, and never add to a losing position to average down.
What to do when your timeframes disagree
Conflicting signals are not a reason to panic. They’re a reason to reduce size or stand aside. Higher timeframes define the dominant flow — when HTF and LTF disagree, the HTF wins by default.
Here’s the decision tree:
- Full alignment (HTF + MTF + LTF all point the same direction): Trade at standard size with normal confirmation thresholds.
- Partial alignment (HTF and MTF agree, LTF is unclear): Wait for LTF to clarify, or enter at reduced size with a tighter stop.
- HTF and MTF disagree: Stand aside. This is a regime transition, and the risk of being caught on the wrong side is too high to justify a normal-size trade.
- All three disagree: Do nothing. There is no edge in a market that can’t decide what it wants to do.
Safe alternatives when alignment is partial:
- Trade the HTF bias with micro-execution only when the LTF shows a clean re-entry signal after a pullback
- Look for range-bound LTF reversals inside HTF ranges, where the HTF is neutral and the LTF is providing the directional signal within a defined zone
Pro Tip: During HTF regime transitions — when a major trend is breaking down or a range is expanding — cut your standard risk in half and require two execution TF confirmations instead of one before entering. The extra friction saves you from a lot of premature entries during choppy transitions.
Five high-edge multi-timeframe strategies you can run now
These five setups cover the most common and reliable multi-timeframe trade templates. Each one uses the 3-TF stack and requires alignment before entry.
1. HTF support bounce with LTF engulfing confirmation
Stack: D1→H4→H1 (swing) or H4→H1→M15 (day trading)
- HTF: price pulls back to a major support level or demand zone that has held at least twice before
- Signal TF: watch for a rejection candle or a bullish structure shift near the HTF level
- Execution TF: enter on a bullish engulfing candle that closes above the previous candle’s high
- Stop: below the execution TF engulfing candle’s low
- Target: next HTF resistance level
- Avoid when: HTF structure is broken and the “support” is now a retest from below
2. HTF resistance retest with LTF rejection
Stack: Same as above, reversed for shorts
- HTF: price rallies into a prior resistance zone or supply area
- Signal TF: look for a bearish break of structure or a shooting star / bearish engulfing
- Execution TF: enter on a bearish rejection wick that closes below the prior candle’s low
- Stop: above the execution TF rejection wick’s high
- Avoid during: major news releases or thin session hours when spreads widen
3. Pullback entry in a trending market
Stack: H4→H1→M15 for day traders; D1→H4→H1 for swing traders
- HTF: clear trend structure (higher highs and higher lows for longs)
- Signal TF: price pulls back to a prior breakout level or a moving average (20 EMA or 50 EMA work well here)
- Execution TF: enter when price forms a higher low and breaks the most recent short-term high
- Stop: below the execution TF higher low
- Target: prior HTF swing high
- Volume note: look for volume contraction during the pullback and expansion on the breakout candle
4. HTF range with LTF reversal at the boundary
Stack: H4→H1→M15
- HTF: price is ranging between two clear levels; no directional bias
- Signal TF: price approaches the range boundary and shows a rejection pattern
- Execution TF: enter on a clean reversal candle at the boundary with a tight stop just outside the range
- Target: the opposite range boundary
- Avoid when: the HTF range is narrowing into a triangle — breakout risk is high
5. Breakout confirmation across timeframes
Stack: D1→H4→H1
- HTF: price breaks a major structural level (swing high, prior resistance) on a daily close
- Signal TF: H4 closes above the same level, confirming the breakout is not a wick
- Execution TF: wait for H1 to pull back and retest the broken level, then enter on a bullish candle
- Stop: below the H1 retest candle’s low
- Target: measured move from the breakout structure
- Avoid: entering on the initial breakout candle without waiting for the retest — breakout fades are common
For chart pattern reference on the signal TF setups above, Tradergibkey’s pattern guide covers the most reliable formations in detail.
The most common multi-timeframe mistakes and how to fix them
Most traders don’t fail because their strategy is wrong. They fail because their process breaks down under pressure. Two to three timeframes are generally enough — checking five or six creates confusion and multiplies false signals.
- Changing your stack mid-experiment: Switching from H4/H1/M15 to D1/H4/H1 after two losing trades is not adaptation — it’s avoidance. Fix: commit to one stack for a minimum of 60 days and review performance before making any structural changes.
For a deeper look at overcomplicated trading systems and how to simplify, Tradergibkey has a dedicated guide that addresses exactly this pattern.
Mentor-annotated trade examples from Tradergibkey
The fastest way to internalize the workflow is to watch it applied in real markets with mentor commentary at each decision point. Tradergibkey’s mentor-guided trade analysis provides annotated examples that trace the full HTF→MTF→LTF sequence, including the reasoning behind each decision.
Here’s how a typical annotated trade walks through the three frames:
Example 1: EUR/USD long on D1→H4→H1
- HTF (D1) markup: Price has pulled back to a major demand zone that previously launched a 300-pip rally. The daily structure is bullish (higher highs, higher lows intact). Bias: long.
- Signal TF (H4) trigger: A bullish engulfing candle forms at the lower boundary of the D1 demand zone. H4 structure shifts from bearish to bullish with a break of the most recent lower high.
- Execution TF (H1) entry: Price pulls back slightly after the H4 signal candle. An H1 bullish pin bar forms at the 50% retracement of the H4 engulfing candle. Entry on the close of that H1 pin bar.
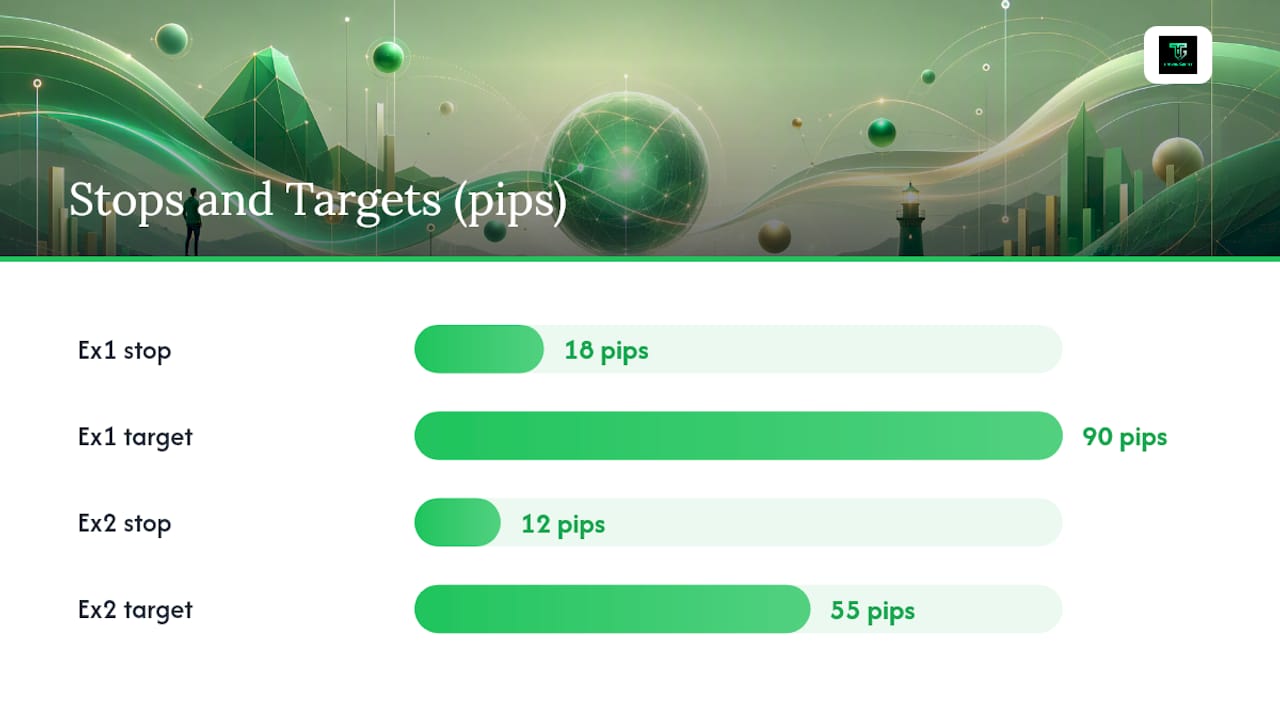
- Stop: Below the H1 pin bar’s low (approximately 18 pips).
- Target: Next D1 resistance level (approximately 90 pips). R:R roughly 5:1.
- Mentor note: “The key decision point was waiting for the H1 pullback rather than entering on the H4 close. That patience cut the stop distance in half and doubled the R:R.”
Example 2: GBP/USD short on H4→H1→M15
- HTF (H4) markup: Price has rallied into a major supply zone. H4 structure is bearish overall — the rally is a retracement, not a reversal.
- Signal TF (H1) trigger: A bearish break of structure on H1 confirms rejection at the H4 supply zone.
- Execution TF (M15) entry: M15 forms a lower high after the H1 break of structure. Entry on the M15 bearish engulfing that breaks the prior M15 low.
- Stop: Above the M15 lower high (approximately 12 pips).
- Target: H4 demand zone below (approximately 55 pips). R:R roughly 4.5:1.
- Mentor note: “The H4 supply zone was the anchor. Without it, the H1 break of structure is just noise. The HTF context is what gave this trade its edge.”
Screenshots to request/produce for each example:
- HTF chart with bias markup and POI highlighted
- Signal TF chart with the trigger candle circled and structure shift annotated
- Execution TF chart with the entry candle, stop level, and target marked
Gabriel brings 18+ years of live trading experience to these annotations. The mentor notes are not theoretical — they reflect real decision points from live market sessions.
Key Takeaways
Multi timeframe analysis works because the HTF defines the dominant flow, and every entry that aligns with that flow carries a structural edge that isolated LTF patterns simply cannot provide.
| Point | Details |
|---|---|
| Use a 3-TF stack | Assign context, signal, and execution roles; never add a fourth TF without removing one. |
| HTF bias is non-negotiable | Trade with the HTF or stand aside; counter-HTF entries require extra confirmation and reduced size. |
| Enforce 4–6x spacing | Adjacent timeframes spaced too close duplicate noise; too wide leaves context gaps. |
| Size by alignment | Full alignment gets full size; partial alignment gets 30–50% less; counter-alignment means skip. |
| Tradergibkey’s workflow | Structured courses and mentor-annotated trades walk you through the full HTF→MTF→LTF process live. |
The discipline gap nobody talks about
Here’s what I’ve seen over 18+ years of live trading: most traders understand multi-timeframe analysis intellectually within a few weeks. The part that takes longer — much longer — is trusting the HTF when the LTF is screaming at you to enter.
The LTF is loud. It moves fast, it generates patterns constantly, and it creates a sense of urgency that the daily or weekly chart never does. That urgency is the trap. When you’re staring at an M5 chart and a beautiful engulfing candle forms, your brain wants to act. The discipline is knowing that without H4 context, that candle is just noise wearing a costume.
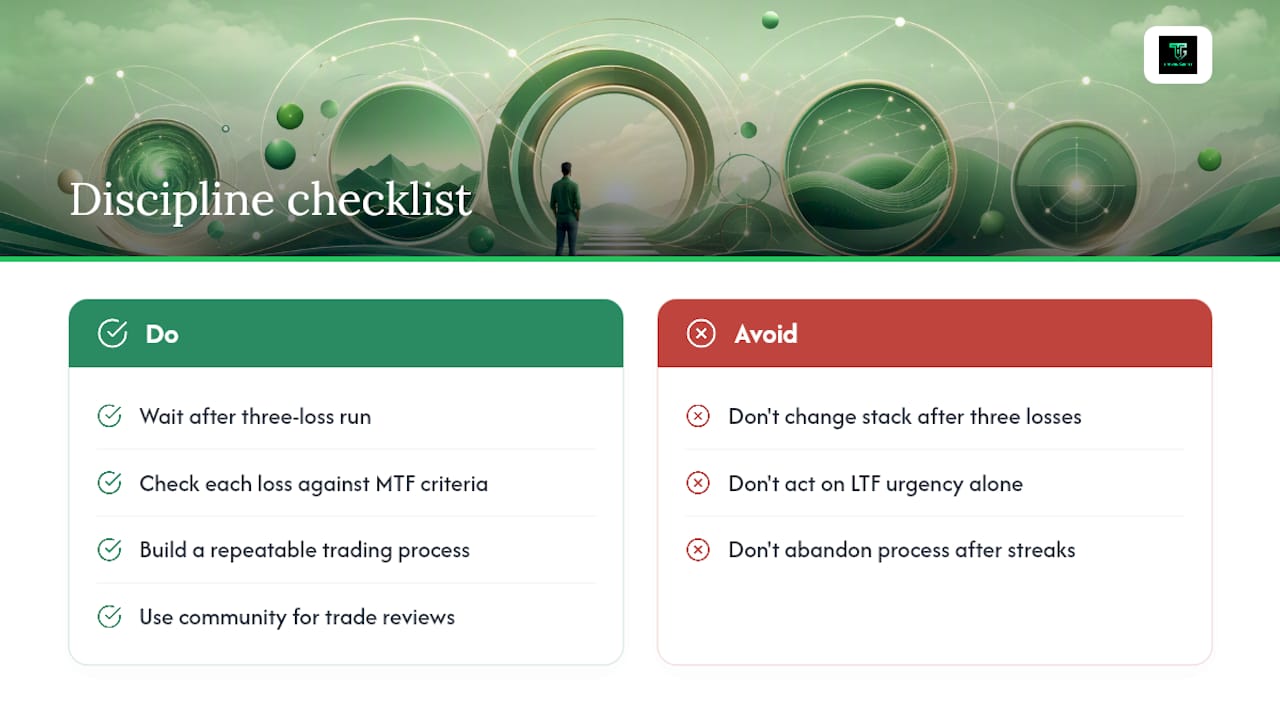
The traders who make this work long-term are not the ones who find the perfect stack or the perfect indicator. They’re the ones who build a process, commit to it for long enough to see real results, and review their trades honestly when things go wrong. Negative streaks are part of the game. The question is whether you change your process because of a streak or because your review data actually shows a structural problem.
One practical habit: after any three-loss run, don’t change your stack. Instead, go back and check whether each loss violated your multi-timeframe criteria. If they did, the problem is execution, not the system. If they didn’t, the system is working and the losses are within normal variance. That distinction matters more than any indicator setting.
The community feedback loop at Tradergibkey exists precisely for this kind of review. You don’t have to figure out whether a losing streak is a process problem or a variance problem alone.
Tradergibkey’s structured path to mastering multi-timeframe trading
If you’ve read this far, you have the framework. What most traders need next is not more theory — it’s guided practice with real feedback on real trades.

Tradergibkey offers structured Forex courses, live trading sessions, and mentor-annotated trade examples that walk you through the exact HTF→MTF→LTF workflow covered in this guide. Every lesson is built around price action in live markets, not textbook scenarios. The community gives you a feedback loop for your trade reviews, and the journaling templates make it easy to track whether your entries are respecting multi-timeframe alignment or drifting back into single-TF habits.
The difference between reading about this process and actually executing it consistently is mentorship and repetition. Visit Tradergibkey’s courses and mentorship hub to see the current programs and find the one that fits where you are right now.
Useful sources and further reading
Practical guides:
- Master Trading With Multiple Time Frames: Techniques for Optimal Entries and Exits
- Multi-Timeframe Analysis: How to Stack Timeframes
- Multi-Timeframe Analysis: Top-Down Framework
- Multi-Timeframe Analysis: The Complete Forex Guide (2026) | ChartSnipe.com
- Multiple Time Frame Analysis: How Top Traders Use It
Institutional frameworks:
- Multi-Timeframe Analysis: Top-Down Framework — institutional top-down workflow with HTF bias as the primary edge source
Video tutorials:
- — session-based adjustments and day trading applications
Tradergibkey resources:
- Trading patterns: top 10 chart setups — signal TF pattern reference for the setups covered in this guide
- Session overlap guide — timing your execution TF entries around high-liquidity windows
- Trading performance review best practices — how to audit your multi-timeframe trades and identify process breakdowns
FAQ
What is the best timeframe combination for multi timeframe analysis? The most practical stack is three timeframes spaced 4–6x apart — for example, H4→H1→M15 for day trading or D1→H4→H1 for swing trading. The exact combination depends on your trading style and how long you hold positions.
What should you do when timeframes conflict? When the HTF and LTF disagree, the HTF takes precedence. Either wait for the lower timeframes to realign with the HTF bias, reduce your position size significantly, or skip the trade entirely.
How many timeframes should you use? Two to three timeframes are enough for most traders. Adding more raises false signals and creates decision paralysis without adding meaningful edge.