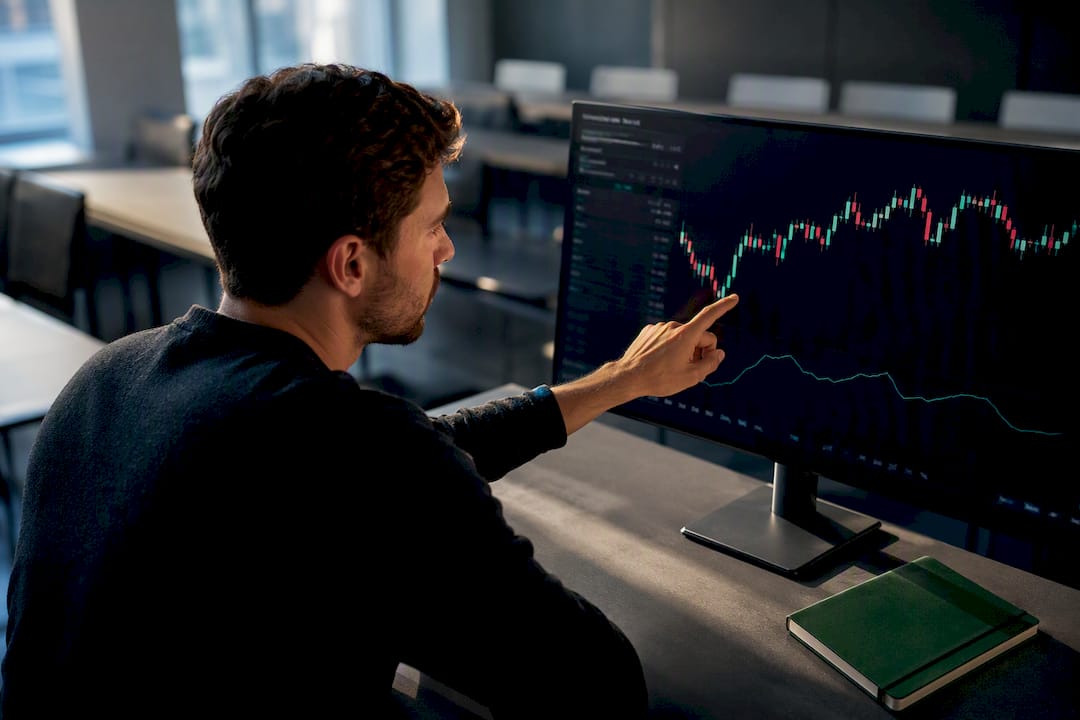
Price action should lead your decisions, and one indicator should confirm them, not drive them. Most traders do best with this hybrid setup rather than picking a side. The right mix shifts with experience and time frame: newer traders and passive swing traders lean more on indicators for structure, while screen-time veterans let price do the talking. The comparison below breaks down exactly where each earns its keep.
TL;DR:
- Traders with limited screen time or a preference for rules should favor indicators, while those with more experience and time should rely primarily on price action.
- Price action responds in real time, making it preferable in fast markets, but it becomes unreliable in choppy, sideways conditions.
- Combining one confirmation indicator with clear structural levels helps avoid conflicting signals and improves trade reliability.
- Overloading charts with multiple indicators often causes noise; sticking to one or two aligned signals yields clearer decisions.
- Practice of price action should include identifying key levels before markets move and waiting for market response to confirm validity.
Table of Contents
- Price Action vs Indicators: A Quick Comparison
- Price Action Trading: Core Concepts and Setups Worth Practicing
- Indicators for Traders: What Each Type Actually Measures
- How Do You Combine Price Action and Indicators?
- Price Action, Indicators, or Both: A Quick Self-Check
- Why We Teach Price Action First
- Ready to Trade Price Action With Guided Feedback?
- Sources
- FAQ
Price Action vs Indicators: A Quick Comparison
Price action and indicators solve different problems, and the gap shows up clearly once you line them up side by side. Price is the raw input. Indicators are a mathematical transform of that input, which means they inherit price’s information but process it with a delay, Optimus Futures notes. That lag is the single biggest thing to understand before you build a strategy around either one.
| Dimension | Price Action | Indicators |
|---|---|---|
| Speed / lag | Leads, reacts in real time | Lags, confirms after the fact |
| Objectivity | Discretionary, open to interpretation | Rule-based, numerically defined |
| Learning curve | Steep, needs screen time | Gentle, clear signals from day one |
| Backtestability | Hard to codify reliably | Easy to code and reproduce |
| Best market regime | Fast, trending, or breakout conditions | Range-bound or slow-drift markets |
| False-signal risk | Lower at clean structural levels | Higher in choppy or sideways price |
Scalpers generally need price action because indicator lag eats the small edge they’re trying to capture. Swing traders often do well blending both, since they have time to wait for a candle close and a confirming reading. Systematic traders tend to favor indicators or codified price-action rules, since backtesting and automation require signals that can be programmed consistently. None of these lanes are fixed. They’re just where each tool’s strengths naturally line up with a trading style.
Price Action Trading: Core Concepts and Setups Worth Practicing
Price action means reading the raw movement of the market itself: candlestick shapes, swing highs and lows, support and resistance, and the overall structure of trend versus range. Traders who use it make discretionary entry and exit decisions based on what price is doing right now, not on a formula calculated from yesterday’s closes.
It shines in fast markets. A breakout through resistance, a sharp rejection off a key level, a clean higher-low forming on a pullback. Price action gets you into these moves before a lagging indicator even registers the shift. It struggles in chop. When a market grinds sideways with no clear structure, the same candlestick patterns that look decisive on a trending chart start throwing out false signals, and two traders can read the identical bar in opposite ways.
A few setups worth building into your practice routine:
- Rejection candle at prior support or resistance. Price tags a level it respected before, prints a long wick, and closes back inside range.
- Breakout and retest. Price closes beyond a level, pulls back to retest it as new support or resistance, then continues.
- Multi-timeframe alignment. The daily trend, the four-hour structure, and the entry timeframe all point the same direction before you pull the trigger.
Your minimal toolkit is genuinely minimal: a clean candlestick chart, horizontal lines marking swing highs and lows, and patience. Investopedia’s rundown of price action strategy basics is a solid starting reference, and it applies across forex, stocks, and futures without modification.
Pro Tip: Mark your levels on a clean chart before the session opens, not while price is already moving through them. Reacting to a level you just spotted mid candle is how good setups turn into rushed, emotional entries.
If you want a deeper walkthrough of structure and trade management, Trader Gibkey’s guide on reading markets instead of guessing covers the setups above in more depth.
Indicators for Traders: What Each Type Actually Measures
Indicators are mathematical transforms of price, and that’s not a criticism, it’s the point. RSI, MACD, moving averages, and ATR each take raw price data and reduce it to a number or a line specifically so you don’t have to interpret a chart by eye. That objectivity is exactly why they’re useful for backtesting and automation: a rule like “buy when RSI crosses above 30” can be coded, tested against years of data, and reproduced identically every time.
The four categories worth knowing:
- Momentum indicators like RSI measure how fast price is moving and flag overbought or oversold conditions.
- Trend indicators like moving averages smooth out noise to show which direction the market is leaning.
- Volatility indicators like ATR measure how much price is moving, which is essential for sizing stops.
- Oscillators like Stochastics and MACD blend momentum and trend signals into a single reading.
The split that matters most is leading versus lagging. Leading indicators like RSI and Stochastics try to anticipate a turn before it happens, which means they also throw more false signals. Lagging indicators like moving averages and MACD confirm a trend that’s already underway, so they’re more reliable but slower to react. Tools like a momentum oscillator for TradingView fall into that leading camp and work best as a secondary filter, not a standalone trigger.
The most common misuse is stacking. Loading five indicators on one chart usually produces conflicting signals, and traders end up curve-fitting their strategy to whatever combination would have worked on last month’s data. Experts consistently warn against this: more indicators rarely means more clarity, it just means more noise to filter through.
How Do You Combine Price Action and Indicators?
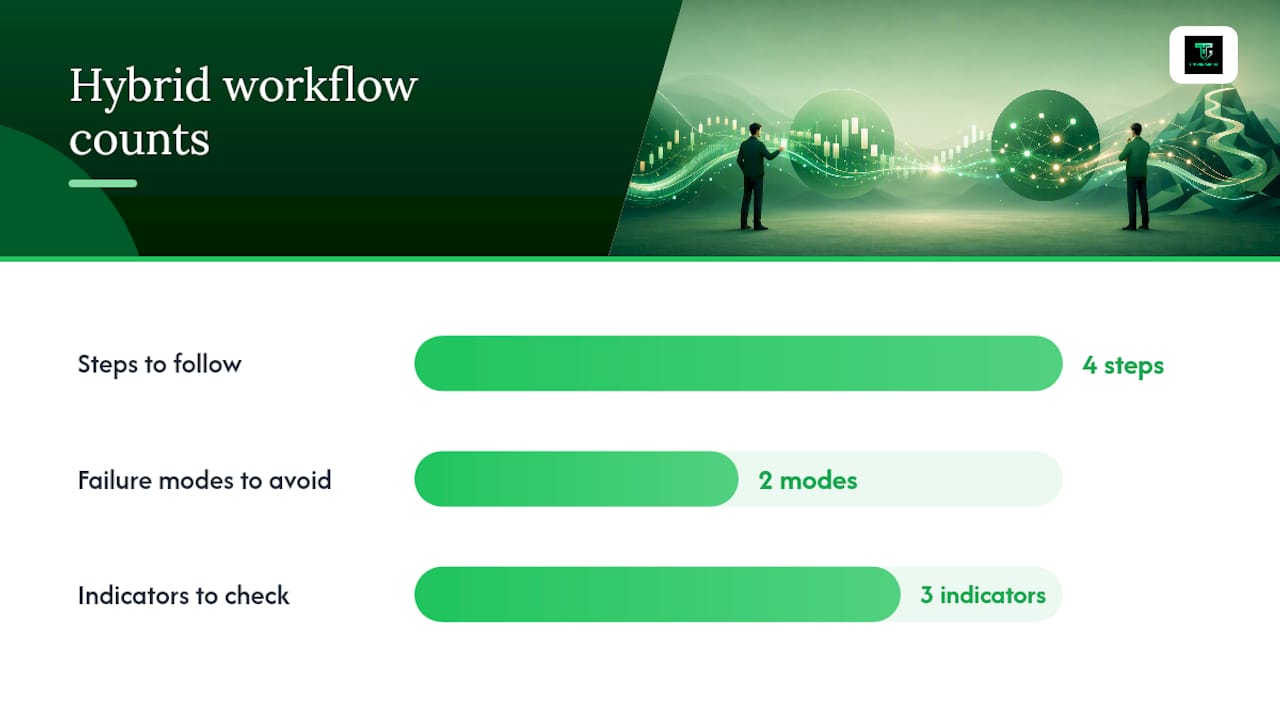
The practical consensus among traders who’ve tested both extremes is a hybrid workflow: price action finds the trade, one indicator confirms it. Here’s how that looks in four steps.
- Map the structure. Mark swing highs, swing lows, and the key support or resistance levels on your chart before price gets there.
- Wait for a reaction. Let price actually respond to the level with a candlestick signal, a rejection wick, an engulfing bar, a clean retest.
- Check one indicator. Look for RSI divergence, confirm the trend direction with a moving average, or check ATR to gauge whether current volatility supports the trade.
- Size and place the trade. Use ATR to size your stop for current volatility, plan your exit before you enter, and size the position to that risk level.
The two failure modes to avoid: stacking multiple indicators on top of your one confirmation tool, and taking a trade because an indicator fired with no structural level backing it up.
Pro Tip: If price action and your one indicator disagree, that’s information, not a tiebreaker to force. Stand aside and wait for the next setup where both agree.
Price Action, Indicators, or Both: A Quick Self-Check
Run through these before you commit to a method:
- Screen time available. If you can watch the market for hours a day, price action’s steeper learning curve pays off faster. If you check charts twice a day, lean toward indicator-led or hybrid.
- Need for backtesting. If you want to prove a strategy works before risking money on it, indicators or codified price-action rules give you something you can actually test.
- Psychological fit. Some traders make better decisions with a numeric rule to lean on. Others find rigid rules fight their instincts and prefer reading structure directly.
- Risk tolerance and discipline. Discretionary price action demands more self-control since there’s no indicator forcing an exit.
Quick mapping: heavy screen time and comfort with discretion points to price-action-led trading. Limited time or a preference for rules points to indicator-led or hybrid. Wanting both speed and objectivity points to hybrid, full stop.
Why We Teach Price Action First
Trader Gibkey’s approach comes from over 18 years of live-market experience, and that time in the market shapes a simple bias: indicators are useful, but they’re a poor substitute for reading what price is actually doing. New traders often reach for RSI or MACD as a crutch to avoid making a discretionary call, and that habit can slow down the timing skills that separate a good entry from a mediocre one.
The learning process typically includes courses, mentorship, and community support where traders can receive direct feedback on their charts, not just theory. Former students consistently describe the shift from second-guessing every candle to trading with a structured, repeatable process.
— Gabriel
Ready to Trade Price Action With Guided Feedback?
If reading charts on your own still feels like guesswork, direct mentorship closes that gap faster than another course you work through alone. Trader Gibkey’s edge comes from 18-plus years of live-market experience distilled into a structured system built around price action and trading psychology, not theory borrowed from a textbook.

Traders can choose from various plans and mentorship sessions as detailed on the provider’s website, which also offers channels for market context alongside individual analysis.
Head to Trader Gibkey’s site to pick the option that matches where you are right now, then start applying the hybrid workflow above with someone checking your work.

This article is general information, not a substitute for advice from a qualified financial advisor. Consult a qualified financial professional about your own circumstances before acting on anything here.
Sources
- Introduction to price action trading strategies — Investopedia
- Price action trading — Wikipedia
- Price Action vs Indicators: Which Trading Approach Wins? — Pipcy
- Price Action vs Indicators – Debunking 5 Common Myths — Optimus Futures
FAQ
Which Is Better, EMA or SMA?
Neither wins outright: EMA reacts faster to recent price and suits shorter time frames, while SMA smooths more and suits longer-term trend reads. Many hybrid traders use both together for context.
What Are the Four Main Types of Indicators?
Momentum (RSI), trend (moving averages), volatility (ATR), and oscillators (MACD, Stochastics) cover the core categories most traders rely on.
Is There an Indicator Better Than RSI?
No single indicator beats RSI universally. MACD offers stronger trend confirmation, while Stochastics can catch turns earlier. The right pick depends on whether you need momentum, trend, or timing information.