
Supply and demand trading means identifying the specific price zones where institutional orders once caused a sharp, imbalanced move, then watching for price to return there to find higher-probability entries. These are zones, not lines. When price comes back to a fresh zone with proper risk management in place, the odds of a reaction improve. That said, nothing here is guaranteed. A zone only earns its keep when it aligns with the higher-timeframe trend and you trade it with discipline.
- Zones mark areas of past institutional order imbalance, not single price points
- Traders use them to time entries when price revisits that area
- Success depends on higher-timeframe alignment and consistent risk rules
Key Takeaways
Supply and demand trading works when traders grade zone freshness and departure strength, align entries with the higher-timeframe trend, and enforce strict risk management on every trade.
| Point | Details |
|---|---|
| Zones are areas, not lines | Mark the base rectangle, not a single swing price, for more precise entries. |
| Freshness decides edge | A first-touch, untested zone carries more weight than one tested three times. |
| HTF alignment is non-negotiable | Only trade zones that agree with the daily or 4H trend direction. |
| Stops need a buffer | Use ATR-based padding beyond the zone edge instead of a boundary stop. |
| Journal every trade | Track outcomes against your grading criteria to refine the system over time. |
Table of Contents
- What Are Supply and Demand Zones in Trading?
- How Do You Identify and Draw Supply and Demand Zones?
- Entry Methods and Trade Execution Around Zones
- What Makes a High-Quality Supply or Demand Zone?
- Which Timeframes Matter Most for Supply and Demand Trading?
- What Mistakes Do Traders Make With Supply and Demand?
- The Trader Gibkey Micro-Routine for Grading Zones Fast
- Sources
What Are Supply and Demand Zones in Trading?
Every zone starts with a base: a tight cluster of small candles where price pauses before an aggressive move fires off in one direction. When that move goes up, you get a rally-base-rally (RBR) or drop-base-rally (DBR) pattern, both marking demand. When it goes down, you get drop-base-drop (DBD) or rally-base-drop (RBD), marking supply. The sharper the departure candle out of the base, the more it suggests large orders were filled unevenly, leaving unfinished business behind.
That unfinished business is the whole premise. A zone represents the footprint of an institutional order imbalance, not a single tick where price “bounced” once. That’s why it’s drawn as a rectangle, not a horizontal line, and why it holds up differently than traditional support and resistance drawn from old swing highs and lows.
- RBR / DBR mark demand zones where buyers likely stepped in heavily.
- DBD / RBD mark supply zones where sellers overwhelmed the base.
- Zones add the most value when the base is tight and the departure candle is large, since that combination points to real institutional order imbalance.
How Do You Identify and Draw Supply and Demand Zones?
Start by scanning for a clear base, usually two to six candles that barely overlap before price explodes away. Mark the top and bottom of that base, not the wick extremes of the whole move. The rectangle should hug the consolidation itself.
Confirm the departure is sharp. You want at least one large-bodied candle breaking clean structure, ideally leaving a visible gap in price action (a fair value gap) as evidence orders got filled aggressively rather than gradually.
- Count the candles in the base. Two to six is typical; more than that suggests indecision, not institutional accumulation.
- Add a small buffer using average true range (ATR) around the rectangle edges instead of drawing it razor-thin.
- Check for a volume spike or an order-flow imprint on the departure candle if your platform shows it.
- Reject the zone if the base is wide and choppy, or if the departure candle is small relative to recent price swings.
Pro Tip: Draw your zone, then walk your eyes left across the chart. If price has already returned to that level twice before you even finished marking it, it’s not fresh, and fresh is where the edge lives.
A quick rejection checklist saves you from marking every minor pause on the chart, which is one of the fastest ways to talk yourself into a bad trade.
Entry Methods and Trade Execution Around Zones
You have two real choices once a zone is marked: place a limit order and walk away, or wait for price to arrive and confirm with a reversal candle first. Set-and-forget limit entries get you in early and often catch the best price, but they also mean occasionally getting run over when a zone fails outright. Confirmation entries sacrifice some entry price for a higher hit rate, since each method carries its own tradeoff between win rate and how closely you have to manage the trade.
- Use a limit order when the zone is fresh, well-aligned with the higher-timeframe trend, and you’re comfortable managing a stop from the moment it fills.
- Wait for price-action confirmation (a pin bar, engulfing candle, or a break of a small internal structure) when the zone is lower quality or counter to recent momentum.
- Place your stop using an ATR-based buffer beyond the zone edge rather than right on the line, since a raw boundary stop gets clipped by ordinary noise. Structure-based stops work too if there’s a clear swing point to hide behind.
- Set targets at the next opposing zone, and don’t take the trade unless it offers at least a 1:2 reward-to-risk ratio from entry to that target. Review execution mechanics in more depth if order types still feel unfamiliar.
What Makes a High-Quality Supply or Demand Zone?
Not every zone deserves your risk. Freshness matters more than almost anything else: a zone that has never been retested holds the full weight of the original unfilled orders, while each subsequent test chips away at that pool, weakening the reaction you can expect. Past three touches, most traders should stop treating the zone as tradable at all.
Departure strength is the second filter. Large-bodied candles, a clean break of structure, and a visible fair value gap all point to genuine imbalance rather than a random pause. Time-in-base matters too. A short, tight base suggests orders got filled fast and there’s likely more sitting unfilled behind them; a long, sprawling base suggests the opposite.
- Freshness: first test only, ideally, never more than three
- Departure strength: large candle body, clear structure break, fair value gap present
- Time-in-base: two to six candles is the sweet spot
- HTF alignment: the zone should sit with, not against, the higher-timeframe direction
Grading callout: A simple four-factor score covering strength, freshness, time-in-base, and profit margin to the next zone gives you a fast pass/fail filter, an approach common among structured grading systems traders use to cut decision time without second-guessing every setup.
Which Timeframes Matter Most for Supply and Demand Trading?
Higher-timeframe zones carry more weight because bigger players build positions there. A daily or weekly zone reflects genuine institutional footprint in a way a 5-minute chart rarely does, which is why zone hunting starts on the higher timeframe and only then drops down.
Once you’ve marked an HTF zone, nest your entry inside it on a lower timeframe. This gets you a tighter stop and a better reward-to-risk ratio without abandoning the directional bias the bigger chart gave you.
- Swing trading: daily zone, 4H structure, 1H entry trigger
- Intraday trading: 4H zone, 1H structure, 15-minute entry trigger
- Smaller accounts often lean intraday for faster feedback; larger accounts can afford the patience swing setups demand
For a deeper walkthrough of how the nesting approach fits together, our multi-timeframe analysis guide breaks down the mechanics step by step.
What Mistakes Do Traders Make With Supply and Demand?
Overmarking is the most common one. Traders new to this method end up with fifteen zones on one chart, half of them meaningless, and lose the ability to tell a strong setup from noise. Zone-jumping (entering a lower-quality zone just because it’s the nearest one on screen) causes the same damage.
Trading against the higher-timeframe trend is the other repeat offender. A perfect-looking demand zone on the 15-minute chart means little if the daily trend is firmly bearish. And failing to reassess a zone after each retest leads traders to keep trading levels that have already given up most of their strength.
- Cap your zones per chart. Mark only the two or three strongest candidates, not every pause you can find.
- Reassess after every touch. Downgrade or delete a zone once it’s been tested more than once.
- Risk no more than 1% to 2% per trade, and only take setups offering at least 1:2 reward-to-risk, ideally 1:3.
- Journal every trade, win or loss, so your zone-grading criteria improve with evidence instead of memory. Our risk management fundamentals guide covers position sizing in more detail.
The Trader Gibkey Micro-Routine for Grading Zones Fast
The routine we teach inside Tradergibkey boils down to three checks performed in order, every time, before a trade goes on. First, grade the zone across freshness, departure strength, time-in-base, and profit margin to the next zone. Second, confirm the higher-timeframe trend actually supports the direction of the trade. Third, set your entry trigger, ATR-buffered stop, and position size before price arrives, not after.
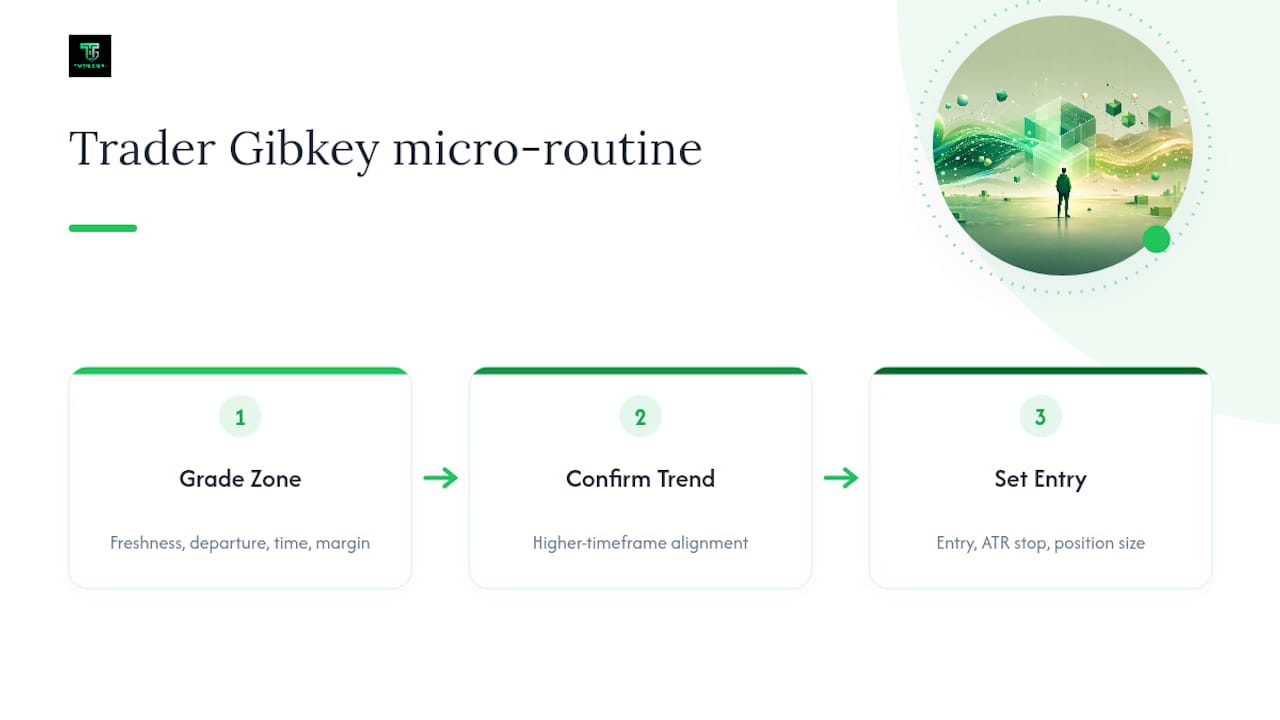
The full sequence looks like this: identify the zone on the higher timeframe, grade it, drop to the lower timeframe for a tight entry candle, place the order with an ATR buffer, size the position to your risk cap, then journal the outcome. It’s the same four-step habit we walk new students through inside the mentorship, and it’s the difference between reacting to a chart and executing a plan.
Pro Tip: If you can’t answer all three checks in under sixty seconds, the setup isn’t ready. Good zones don’t require debate.
When Should Supply and Demand Be Core to Your Approach?
Indicator-heavy systems lag price. Supply and demand puts you closer to where real orders sit, which is why it deserves a central role once you’ve paired it with sound risk management rather than treated it as a standalone signal. It works best alongside solid execution, not instead of it. Backtest your rules, journal every result, and let the evidence, not your gut, decide which setups earn your capital.
— Gabriel
Sources
For deeper study, see zone identification fundamentals, strategy backtesting methods, and order-flow analysis basics.
This article is general information, not a substitute for advice from a qualified financial advisor. Consult a qualified financial professional about your own circumstances before acting on anything here.
- How to identify institutional demand and supply zones | NinjaTrader | NinjaTrader
- Supply and Demand Trading Zones Explained | TrendSpider
- Supply and Demand Trading: How to Find, Trade, and Profit from High-Probability Zones | AlgoAlpha