
Trade the retest, not the breakout: wait for price to close beyond a key level, let it pull back and show rejection, then enter with a stop just beyond that retest candle. This gives you a tighter stop and a cleaner invalidation point than chasing the initial break, though it means you’ll sometimes miss moves that never come back. The rest of this guide covers the checklist, entry and stop rules, position sizing, and a full worked example.
TL;DR:
- Waiting for a confirmed close beyond a level, a retest, and a slow return signal improve trade accuracy but may result in missing quick moves.
- Retests are most effective in trending markets with strong levels, high liquidity, and clear structure, especially on higher timeframes.
- Entry approaches include waiting for a rejection candle to close and placing stops just beyond the retest candle’s extreme for optimal risk management.
- The retest often takes longer to arrive during stronger moves, making patience and proper level marking essential for successful trades.
- Indicators support the price action but should not override clear rejection signals at the level, reducing false breakouts.
Table of Contents
- What Is Break and Retest Trading?
- How to Confirm a Break and Retest Setup Step by Step
- Entry Rules and Stop-Loss Placement for Retest Trades
- Position Sizing and Risk Management Around the Retest
- Using Multiple Timeframes and Indicators to Confirm the Retest
- Common Mistakes: False Breaks and Deep Retests
- A Worked Example: Trading the Retest Step by Step
- Gabriel’s Field Notes on Retest Trading
- Learn the Full Retest System With Trader Gibkey
- Sources
- FAQ
What Is Break and Retest Trading?
A retest happens when price breaks a key support or resistance level, then returns to touch that same level before continuing in the breakout direction. Old resistance flips into new support, or old support flips into new resistance. That’s the role reversal traders are watching for, and it’s the whole logic behind waiting instead of chasing.
The tradeoff is real. Waiting for confirmation improves your entry price and shrinks your stop distance, but empirical work on breakout patterns shows some of the strongest moves never look back. You’re trading precision for a slightly lower hit rate on catching every winner.
Retest setups tend to work best under specific conditions:
- Trending markets with clear directional momentum, not choppy range-bound sessions
- Active trading hours with real liquidity (London/New York overlap in forex, regular session hours in equities and indices)
- Levels with a real history: multiple touches, round numbers, or prior swing points that other traders are also watching
- Clean structure on the higher timeframe, without a pile of overlapping levels muddying the picture
How to Confirm a Break and Retest Setup Step by Step
Before you risk a dollar, you need a repeatable process for marking levels, judging the break, and reading the retest itself. Skipping steps here is where most retest trades go wrong.
- Mark your key levels first. Use swing highs and lows, horizontal support/resistance, trendlines, and range extremes on your higher timeframe chart. Fewer, cleaner levels beat a chart cluttered with every minor pivot.
- Wait for a decisive break. A wick poking through a level means nothing. Look for a candle close beyond it, ideally with a buffer scaled to volatility (an ATR-based cushion works better than a fixed pip or point count) and some volume expansion behind it, per common breakout confirmation filters.
- Let price come back. A clean retest holds near the broken level and doesn’t slice back through it with authority. A deep retest that closes back inside the old range is a weaker signal.
- Read the rejection candle. You want a pin bar, an engulfing candle, or simply a candle with a small body and long wick pointing away from the level. Momentum on the way back down (or up) should feel slower than the original break.
- Switch timeframes for execution. Mark structure and bias on the 4H or daily chart, then drop to the 15 minute or 1 hour chart to time the actual entry against the retest candle.
Pro Tip: Count the candles it takes price to travel back to the level. A retest that arrives slowly on shrinking momentum reads very differently from one that snaps back in two candles. Slow is usually the better sign.
Entry Rules and Stop-Loss Placement for Retest Trades
Once the rejection candle closes, you have two honest options. The aggressive entry triggers right on the close of that rejection candle. The conservative entry waits one more candle for follow-through in the breakout direction, which costs you a slightly worse price in exchange for more confirmation.
Order type matters here too. A limit order at the retest zone gets you a better fill if price is still approaching the level. A market order makes more sense once the rejection candle has already closed and momentum is resuming, because waiting for a better price at that point often means missing the trade entirely. This is a decision covered in more depth in trade execution best practices, including how slippage factors into which order type wins.
Stop placement is where the retest approach earns its keep:
- Preferred: just beyond the extreme of the retest candle itself, since that’s the tightest logical invalidation point
- More conservative: just beyond the extreme of the original breakout candle, giving the trade more room if you’re sizing down anyway
- Never: an arbitrary fixed distance unrelated to the actual candle structure
For targets, use the next major structural level, a measured move projected from the prior range, or a straightforward risk-reward multiple. Many retest traders anchor to 2R to 3R as a baseline target, adjusting down if a closer structural level sits in the way. The breakout retest tradeoff research is blunt about this: a tighter stop only helps your expectancy if your target math respects it.
Position Sizing and Risk Management Around the Retest
Your position size should flow directly from the distance between your entry and your stop, not from a gut feeling about how “sure” you are. Decide your fixed percent risk per trade first (many traders use 1% or less of account equity), then work backward from the retest stop distance to figure out how many units or lots that risk actually buys you.
A few adjustments matter once you’re in the trade:
- Reduce size when the retest is deep or came on visibly low volume, since both point to a weaker setup
- Scale in only after price confirms the retest is holding, never before
- Take partial profits at your first structural target, then trail the remainder using a moving stop or the most recent swing low/high
- Cut size to near zero, or skip the trade, if the retest keeps probing the level without producing a clean rejection
For the mechanics of translating stop distance into lot size, risk management rules for new traders walks through the actual calculation.
Pro Tip: *Write your position size formula down once, on paper or in a spreadsheet, and never do it from memory mid-trade.
Using Multiple Timeframes and Indicators to Confirm the Retest
Structure and bias come from the higher timeframe. Confirm the breakout on the 4H or daily chart first, then drop down to the 15 minute or 1 hour chart to time your actual entry against the retest candle. This two-step workflow keeps you from getting faked out by noise that looks significant only on a small timeframe.
Indicators have a supporting role here, not a leading one:
- Volume should spike on the original break and go quiet on the retest itself; a loud, high-volume retest is a warning sign
- ATR helps you size a sensible buffer for what counts as a “real” break versus a wick
- RSI or MACD can confirm momentum is aligned with the breakout direction, useful as a tiebreaker, not a trigger
Price action at the level itself is still the primary signal. If your indicators say “go” but the rejection candle at the retest looks weak or absent, skip the trade. Indicators are there to filter out marginal setups, not to override what the candles are actually doing at the level that matters. A tool like AI-assisted trade analysis can help flag volume and momentum shifts faster, but it still reads the same price structure you’re watching on the chart.
Common Mistakes: False Breaks and Deep Retests
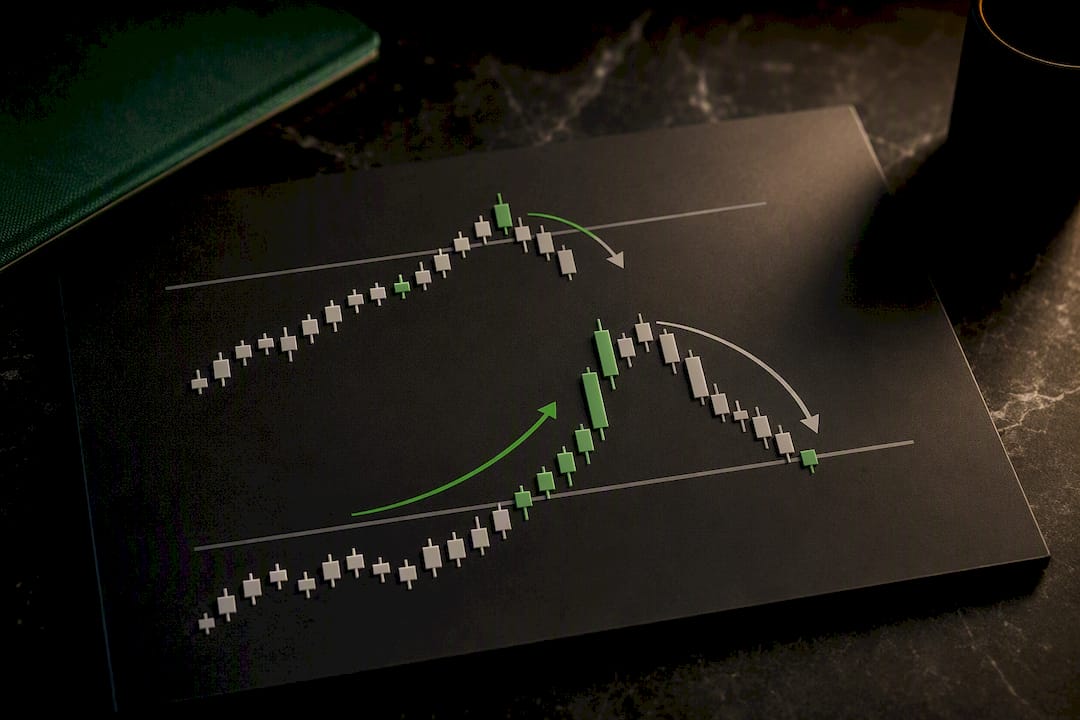
A clean retest holds close to the broken level and shows a sharp rejection candle. A deep retest slices back well into the old range before turning around, which historically precedes weaker follow-through than a clean one. Treat deep retests as a caution flag, not an automatic pass.
Watch for these signs that you’re looking at a fakeout rather than a genuine break, a distinction Investopedia’s definition of a fakeout covers directly:
- Choppy, overlapping candles around the level instead of a decisive move
- Low or fading volume on the initial break
- Multiple retests of the same level without a single clean rejection candle
- Price closing back through the level after appearing to hold it
When you spot these, the defensive move is simple: widen your stop only if you also shrink your size, or just skip the setup entirely. A pattern that requires you to justify why “this time is different” usually isn’t. For a deeper breakdown of these traps, see false breakout trading signals and the structure-shift rules in BoS and CHoCH price action.
A Worked Example: Trading the Retest Step by Step
Here’s how the full sequence plays out on an actual chart, using round numbers to keep the math clean.
- On the daily chart, a stock has been capped by resistance at $50 for three weeks. That’s your marked level.
- Price closes at $50.80 on rising volume, breaking above resistance. That’s your confirmed break.
- Over the next two sessions, price drifts back down toward $50, on noticeably lighter volume than the breakout candle.
- On the 1 hour chart, price touches $49.90, then prints a bullish engulfing candle that closes at $50.60. That’s your rejection.
- You enter at $50.65 on the close of that candle, with a stop at $49.75, just beyond the retest candle’s low. Risk is $0.90 per share.
- Your target sits at the next structural resistance around $53, which is roughly $2.35 away, giving you close to 2.6R.
If step 3 had shown price closing back below $50 with heavy volume, or step 4 had produced no clear rejection candle after three separate touches, the correct move would be to walk away rather than force an entry. The setup either confirms cleanly, or it doesn’t.
Gabriel’s Field Notes on Retest Trading
After 18 years watching this pattern play out across sessions, my honest take is that most traders overcomplicate the retest and undercomplicate the patience it requires. My own default is a daily chart for the level, a 1 hour chart for the trigger, and nothing smaller. That’s it.
The one rule that surprises people: a retest that takes longer to arrive is usually a better retest. Speed reads as urgency, and urgency in a pullback often means the move isn’t done correcting. Journal every retest trade you take, including the ones you skipped, because the skipped setups teach you more about patience than the winners do.
— Gabriel
Learn the Full Retest System With Trader Gibkey
Reading the rules is one thing. Running them live, on your own charts, with real feedback when a retest goes wrong, is another. Trader Gibkey’s courses and mentorship build directly on the price-action framework covered here, with structured lessons, live trading sessions, and a community of traders working through the same break, retest, and confirmation sequence in real market conditions.

Members get market analysis highlighting active retest setups, risk management training focused on stop placement decisions, and a trading journal system to track different retest scenarios. If you want guided practice instead of piecing this together alone, check the Trader Gibkey mentorship options and see which format, course access, live sessions, or one-on-one mentorship, fits where you are right now.
Sources
- Capital
- The Breakout Retest: A tighter entry with a real tradeoff | DayTradingToolkit
- Fakeout definition | Investopedia
FAQ
What is the 3-5-7 rule in trading?
It’s a risk guideline suggesting you risk a small, controlled percentage on any single trade, limit overall exposure across open trades, and aim to achieve meaningful gains before scaling up exposure. Treat it as a starting framework, not a fixed law.
What counts as a retest in trading?
A retest is price returning to touch a level it just broke, support or resistance, before continuing in the breakout direction. A clean retest holds near that level; a deep retest pushes well back into the old range first.
What does a break mean in trading?
A break happens when price closes beyond a defined support or resistance level, ideally backed by volume expansion, signaling that the old boundary has failed to hold.