
A pullback trading strategy means entering in the direction of an established trend after price temporarily retraces, then confirms it’s ready to resume. It works best on a clean uptrend or downtrend with real volume behind it, on a timeframe that matches your available screen time. The edge comes from waiting for confirmation near a defined support or resistance level and keeping your stop tight against the invalidation point.
TL;DR:
- Traders should wait for confirmation signals such as rejection candles or trendline breaks before entering a pullback trade, not buy blindly during dips.
- Combining Fibonacci levels with other confluence factors like moving averages and volume spikes significantly increases the reliability of a pullback setup.
- Proper risk management involves placing stops just beyond invalidation points and risking no more than 1% of the account per trade.
- Pullbacks are most effective in clear, trending conditions and tend to resolve faster during high-liquidity periods like the London to New York overlap for forex.
- Avoid trading in choppy or range-bound markets, as pullback strategies underperform when there is no genuine trend to retrace.
Table of Contents
- What Is a Pullback Trading Strategy, and How Does It Differ From a Reversal?
- Why Pullback Trading Works: Liquidity, Institutional Flow, and Confluence
- How Do You Enter a Pullback Trade Step by Step?
- Which Indicators Actually Confirm a Pullback Entry?
- How Do You Manage Risk on a Pullback Trade?
- Two Worked Examples: One Forex, One Stock
- Common Mistakes That Ruin Pullback Trades
- How Trader Gibkey Teaches Pullback Trading
- When Do Pullbacks Beat Breakouts in Your Trading Plan?
- Learn to Trade Pullbacks With Direct Feedback, Not Just Theory
- Sources
- FAQ
What Is a Pullback Trading Strategy, and How Does It Differ From a Reversal?
A pullback is a temporary reversal within an overall trend — the key word is temporary. The larger trend resumes once the pullback runs out of steam, which is exactly what separates it from a true reversal, where the trend actually changes direction for good.
A retracement is the technical term for that pause. It’s a short-term reversal inside a larger trend and should never be treated as proof the trend is continuing just because it happened. That’s the trap: seeing a dip and assuming it’s automatically a buying opportunity. You still need confirmation.
Here’s how to tell the three apart on a chart:
- Pullback: price pauses or dips a moderate portion of the prior move, volume typically fades during the pullback, and the broader structure (higher highs and higher lows, or the reverse) stays intact.
- Retracement: the measurable price move itself, usually described by depth (a “38% retracement” or “61% retracement”) rather than by outcome.
- Reversal: price breaks the prior structure, makes a lower high in what was an uptrend (or a higher low in a downtrend), and often comes with a volume surge in the new direction.
Depth and duration both matter. If your instinct says “this is taking too long,” trust it. Quick signs the trend is still intact: shrinking volume on the retracement, price respecting a moving average or trendline instead of slicing through it, and momentum indicators cooling off without collapsing.
Why Pullback Trading Works: Liquidity, Institutional Flow, and Confluence
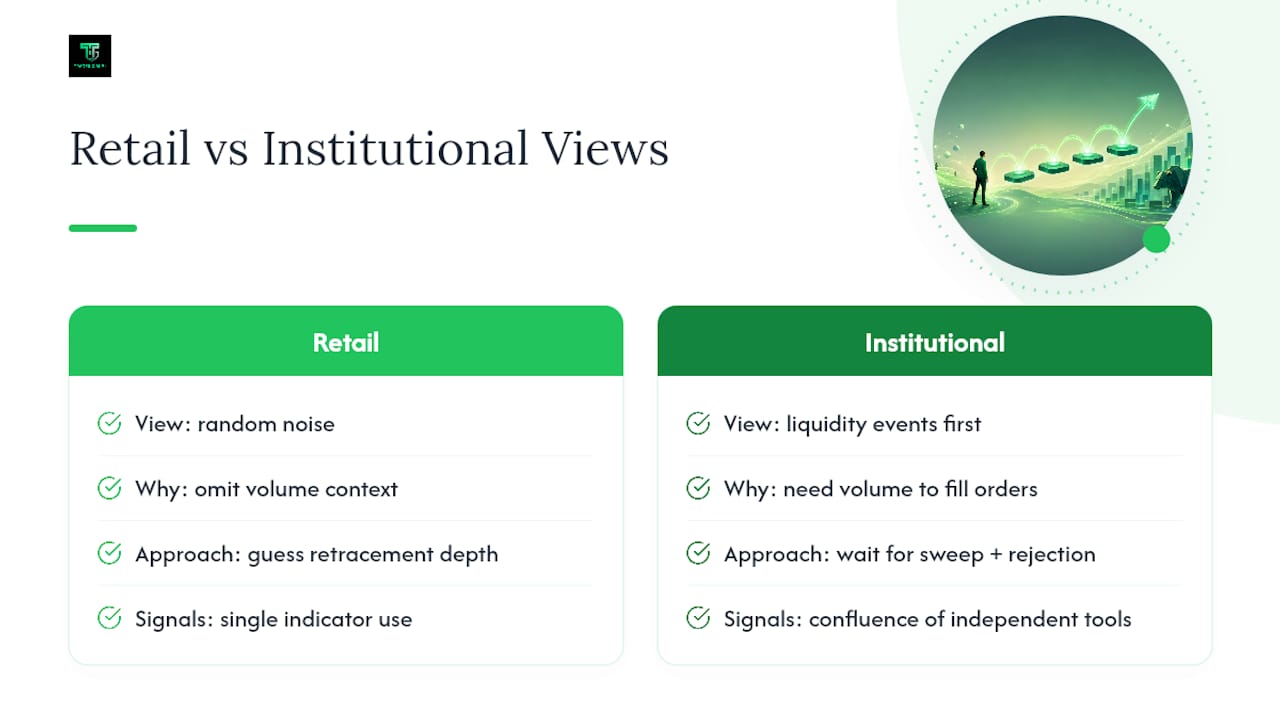
Retail traders tend to think of pullbacks as random noise. They’re usually not. Larger players need volume to fill sizable orders, and thin, retraced price zones are where that volume often shows up. That’s why price so often dips into a prior support level, sweeps the stops sitting just below it, and then snaps back in the direction of the trend.
Institutional-level analysis treats pullbacks as liquidity events first and technical patterns second. High-probability setups depend on structure, liquidity interactions, and confirmation, not on guessing a retracement depth in advance. That single idea reframes the whole strategy: you’re not predicting where price will stop falling, you’re waiting for evidence that the stop-hunt is done.
Institutional traders often induce liquidity sweeps before continuation. Waiting for the sweep and the rejection that follows reduces the odds of walking straight into someone else’s stop-hunt.
This is why we keep hammering “confluence” instead of picking one magic indicator. A Fibonacci level by itself is just a number on a chart. A moving average by itself gets faked out constantly in choppy conditions. But a Fibonacci zone that lines up with a moving average, a prior support level, and a drop in selling volume? That’s a real zone, built from several independent signals agreeing at once. Order-block and liquidity-sweep frameworks work the same way. They’re most useful when you align the higher-timeframe structure with a lower-timeframe trigger before you risk a dollar of capital, not when you use them as a standalone signal.
How Do You Enter a Pullback Trade Step by Step?
This is the checklist we’d want a new trader running through before every single entry. Skip a step and you’re gambling, not trading.
- Confirm the higher-timeframe trend. Pull up the daily chart if you’re trading the 1-hour, or the 4-hour if you’re trading the 15-minute. You need clear higher highs and higher lows (or the mirror image in a downtrend) before you even think about a pullback entry.
- Check the pullback’s depth and shape. A shallow pullback near minor retracement levels suggests strong trend momentum. A deeper one near major retracement levels is still tradable but demands stricter confirmation. Very deep pullbacks border on potential reversals, not pullbacks.
- Wait for an entry trigger. Don’t buy the dip blind. Wait for a rejection candlestick (a pin bar or engulfing candle) at your support zone, or a break back above a short-term trendline drawn across the pullback itself.
- Place your stop below the pullback low (in an uptrend) or above the pullback high (in a downtrend). Practical entry rules call for a stop below the pullback low, entering only on confirmation at a support level like a moving average, prior breakout point, or VWAP.
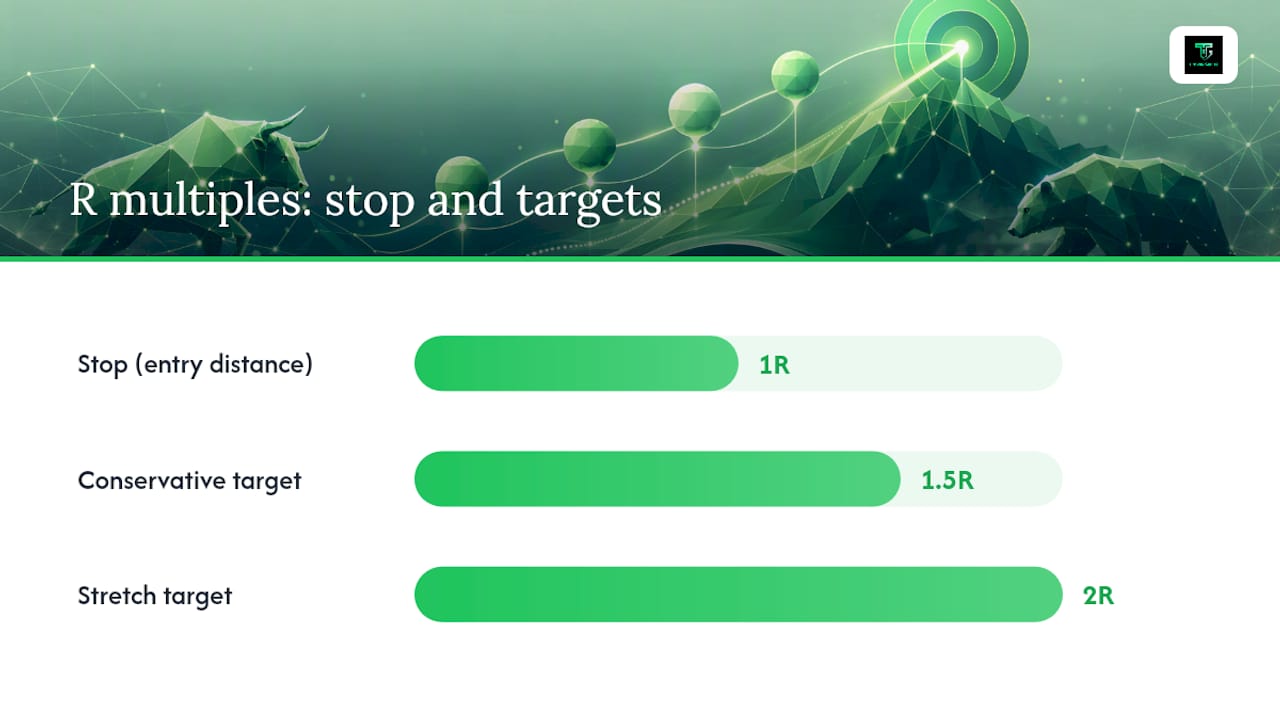
- Calculate your target using R multiples. If your stop is 20 pips away from entry, that’s your 1R. A conservative first target sits at 1.5R to 2R, with a stretch target at the prior swing high or beyond.
Pro Tip: Mark your pullback zone before price gets there, not after. Waiting for the setup to fully form before you draw anything on the chart usually means you’re reacting to the move instead of anticipating it, and reacting is how good setups get missed by seconds.
A 3-touch trendline across the pullback itself often gives you the cleanest trigger of all, since a break of a trendline that’s already been tested multiple times tends to carry more weight than a single candle pattern in isolation.
Which Indicators Actually Confirm a Pullback Entry?
No single indicator earns its keep alone. What separates a consistent pullback trader from someone throwing darts is stacking two or three signals that independently point to the same zone.
Fibonacci retracements remain the starting point for most traders. Draw the tool from swing low to swing high (or the reverse in a downtrend), and pay close attention to the 50% to 61.8% zone, often called the golden zone, though it should never be traded in isolation. Fibonacci levels function as psychological zones, and they’re most reliable when other signals confirm the same price area rather than standing alone.
Moving averages act as dynamic, moving support. The 20 and 50-period exponential moving averages (EMAs) are the most commonly watched on intraday and swing charts, while the 50 and 200-period simple moving averages (SMAs) matter more on daily charts. When price pulls back and touches one of these instead of crashing through it, that’s meaningful.
VWAP (volume-weighted average price) is the intraday trader’s best friend, particularly on stocks. A pullback that holds above VWAP in an uptrend, on rising relative volume, tells you buyers are still stepping in at a fair average price rather than fleeing.
Volume itself deserves its own line item. Watch for volume to fade during the pullback and then expand again on the resumption candle. That expansion is often your clearest confirmation of all.
Here’s a realistic confirmation stack that shows up often enough to be worth memorizing:
- Price retraces into the 50 to 61.8% Fibonacci zone.
- That zone lines up closely with the rising 20 EMA.
- Volume on the pullback candles has been noticeably lighter than on the trend candles.
- A bullish engulfing or pin bar prints right at the zone, on a volume uptick.
When three or four of those align at once, you’re not gambling on a Fibonacci number, you’re trading a genuine confluence of horizontal and dynamic support.
How Do You Manage Risk on a Pullback Trade?
Every pullback strategy lives or dies on where you place your stop and how much you risk per trade, not on how good the entry signal looked.
- Stop placement: put your stop just beyond the invalidation point, whether that’s the pullback’s swing low or the 100% retracement level. If price trades past that point, your trend read was wrong.
- Position sizing: risk a fixed percentage of your account, commonly 1% or less per trade, and size your position backward from your stop distance in pips or dollars.
- Volatility awareness: Average True Range (ATR) helps you avoid placing a stop so tight that normal volatility knocks you out before the trade even gets going.
- Profit taking: scale out in pieces. Take a partial at 1.5R to lock in a win, move your stop to breakeven, then trail the remainder using a moving average or the most recent swing low.
- Journaling: record every trade’s entry logic, R outcome, and what you’d change. Patterns in your own mistakes show up faster on paper than in your memory.
Position sizing math matters more than most beginners assume, and getting the R-based calculation right is often the difference between a strategy that survives a losing streak and one that doesn’t. Understanding risk before you ever place a trade is basic advice, but Investor is worth revisiting even for traders who’ve been at this for years. It’s easy to forget the fundamentals once you’re staring at candles all day.
Two Worked Examples: One Forex, One Stock
Forex example (EUR/USD, 4-hour chart):
- Price is in a clear uptrend, printing higher highs and higher lows over the past three weeks.
- Price pulls back 45% into a zone where the Fibonacci retracement lines up with the rising 50 EMA.
- A bullish pin bar forms at that zone during the London session, with volume ticking up on the close.
- Entry triggers on the pin bar’s close. Stop goes 15 pips below the pin bar’s low. First target sits at 1.5R, with the remainder trailed toward the prior swing high.
- Invalidation: if price closes below the 61.8% Fibonacci level, the setup is off.
Stock example (a large-cap tech name, daily chart):
- The stock is in an uptrend following an earnings gap, holding well above its 20-day SMA.
- Price pulls back to test the 20-day SMA and VWAP from the breakout day, on noticeably lighter volume than the run-up.
- A bullish engulfing candle prints at the SMA, with volume expanding back above average the next session.
- Entry on the engulfing candle’s close, stop below that candle’s low, first target at the prior high.
The main difference between the two isn’t the mechanics, it’s session timing. Forex pullbacks often resolve fastest during the London to New York overlap, when liquidity is deepest. Stock pullbacks tend to confirm in the first or last hour of the trading day, when institutional volume actually shows up on the tape.
Common Mistakes That Ruin Pullback Trades
Most losing pullback trades share the same handful of root causes.
- Buying mid-pullback, before any confirmation candle has printed, just because price “looks cheap.”
- Ignoring volume entirely and trading the Fibonacci level as if it’s guaranteed support.
- Averaging into a losing position as the pullback deepens past your original invalidation point, which turns a small planned loss into a large unplanned one.
- Trading choppy, directionless ranges where there’s no real trend to pull back from in the first place. Pullback strategies consistently underperform in choppy conditions and after extended runs that have already exhausted the move.
- Trading straight through major news releases, when volatility spikes make every level unreliable for minutes or hours at a stretch.
Before entering, run a quick skip-check: is the higher-timeframe trend actually clear? Is volume behaving the way it should on the pullback? Has a real confirmation signal printed yet? If any answer is no, the trade can wait. There’s always another setup coming.
How Trader Gibkey Teaches Pullback Trading
Tradergibkey built its curriculum around 18-plus years of live-market trading experience, not backtested theory disconnected from how price actually behaves under pressure. The checklist in this article, trend confirmation, depth screening, trigger candle, stop placement, R-based targets, isn’t abstract. It’s the same sequence taught step by step inside the Price Action (Core) program, then drilled live during mentorship sessions where students bring real charts and get direct feedback on their entries.
Community members work through pullback setups together in real time rather than studying static examples alone, which is where most of the actual skill transfer happens. Confidence with a strategy like this comes from repetition under supervision, not from reading a single article and hoping the next chart cooperates.
When Do Pullbacks Beat Breakouts in Your Trading Plan?
We favor pullbacks over breakouts whenever a trend already has clear structure, since you get a better entry price and a tighter stop than chasing a breakout candle. Breakouts earn their place in choppier conditions where price hasn’t established a rhythm yet. Build your weekly plan around scanning for trend candidates first, then let the pullback come to you. One caution: don’t over-optimize the confirmation stack until no setup ever qualifies. A strategy that never triggers isn’t a strategy.
— Gabriel
Learn to Trade Pullbacks With Direct Feedback, Not Just Theory
Reading a checklist is one thing. Running it live on a moving chart, with someone correcting your entry before it costs you money, is another. Tradergibkey’s edge over generic courses and signal services is that every strategy taught, pullbacks included, comes from 18-plus years of live execution rather than a backtest run in hindsight.

If you want structured practice with the exact rules covered here, the Price Action (Core) plan runs £149 per month and walks through entry criteria, confirmation stacks, and risk rules in a guided format. Traders who want direct correction on live setups can book a Single Session Mentorship for 149 € to get feedback on real charts, or step up to the 5-Session Mentorship at 559 € for deeper, ongoing review. For daily market context around pullback zones as they form, the Weekly Telegram channel runs 49 € per week. Head to the Tradergibkey site to pick the format that fits how you actually want to learn.
This article is general information, not a substitute for advice from a qualified financial advisor. Consult a qualified financial professional about your own circumstances before acting on anything here.
Sources
- Pullback: What It Means in Trading, With Examples
- How To Trade Pullbacks In Forex (Advanced Institutional Strategy & Execution Guide) — The Capital Process
- How to use Fibonacci retracements
FAQ
Is Pullback Trading Profitable?
It can be, when paired with strict entry confirmation and disciplined risk management, but no strategy wins every trade. Profitability comes from consistent risk-reward ratios across many setups, not from any single trade.
What Is the 3-5-7 Rule in Trading?
Definitions of this rule vary across trading communities, and there’s no single standardized version tied to pullback trading specifically, so we won’t assign it a false definition here.
How Do You Predict a Pullback?
You don’t predict the exact depth in advance. You watch for fading volume, a pause near a moving average or Fibonacci zone, and a rejection candle before treating the pullback as tradable.
Is a Pullback a Good Time to Buy Stocks?
Only after confirmation. A pullback that holds above a moving average or VWAP on shrinking volume, then reverses on a bullish candle, is a stronger buy signal than the dip alone.