
Risk management and position sizing in practice are defined as the two core disciplines that determine how much capital you risk per trade and how you calculate the exact number of units to buy or sell. The 1% risk rule advises risking no more than 1% of total account equity per trade, giving you the staying power to survive losing streaks. Professionals often go lower. Position sizing is not about gut feel. It is a formula-driven process anchored to your stop loss distance and account size. Tradergibkey has spent over 18 years applying these principles in live Forex markets, and the difference between traders who last and those who blow up almost always comes down to whether they treat sizing as a hard rule or an afterthought.
How to calculate position size using the universal formula
The universal position size formula is: Position Size = (Account Size × Risk Percentage) ÷ Stop Distance. This formula is the foundation of effective position sizing and removes emotion from the equation entirely.
Here is how to apply it step by step:
- Define your account size. Start with your total trading capital. If you have $50,000 in your account, that is your baseline.
- Set your risk percentage. The industry standard sits at 1–2% for retail traders. Use 1% as your default. That means you are willing to lose $500 on a single trade.
- Identify your stop distance from the chart. Your stop must come from market structure, not a round number you picked arbitrarily. A prior swing low, a key support level, or a volatility measure gives you a logical invalidation point. If your stop is $2 away from your entry, that is your stop distance.
- Run the formula. $50,000 × 0.01 = $500 risk. $500 ÷ $2 stop distance = 250 units. You buy 250 shares or units, no more.
- Adjust for commissions and slippage. Real-world execution costs eat into your risk budget. Subtract estimated commissions from your dollar risk before dividing by the stop distance.
The critical insight here is that you size to your risk, not to a share count you feel comfortable with. Most new traders do the opposite. They pick a round number of shares and then check if it “feels right.” That approach ignores stop distance entirely and leads to wildly inconsistent risk across trades. When your stop is wide, your position must be smaller. When your stop is tight, you can take a larger position. The formula enforces that logic automatically.
Pro Tip: Always calculate your position size before you place the order, not after. Pre-trade sizing is a hard rule, not a suggestion.
How does ATR-based sizing work in volatile markets?

Average True Range, or ATR, measures how much an instrument moves on average over a set period, typically 14 bars. ATR-based sizing adjusts your stop distance dynamically to match current market volatility, keeping your risk per trade consistent even when conditions shift.
Here is why static stops fail in volatile markets:
- A $2 stop on a calm day may be perfectly placed outside the noise. That same $2 stop during a high-volatility session gets hunted before the trade has a chance to develop.
- ATR solves this by setting stops as a multiple of the current ATR reading. Common multiples range from 1.5 to 2.5 times ATR, depending on the instrument and timeframe.
- When volatility rises, ATR expands, your stop widens, and your position size shrinks automatically to keep dollar risk constant.
- When volatility contracts, ATR shrinks, your stop tightens, and you can take a larger position for the same dollar risk.
The practical result is that ATR-based sizing equalizes risk across instruments with very different volatility profiles. A Forex pair and a commodity can both be sized to the same 1% risk even though their daily ranges differ dramatically. You are not comparing apples to oranges anymore. You are comparing risk to risk.
Pro Tip: Use the 14-period ATR on your primary timeframe. Multiply it by 1.5 as your default stop distance, then run the position size formula from there. Adjust the multiple up in choppy conditions.
What is total portfolio heat and why does it matter?
Total portfolio heat is the sum of all open risk across every active position at any given moment. Correlated positions can double or triple your actual risk exposure even when each individual trade sits at 1%. That is the hidden danger most traders ignore.
The standard rule caps total portfolio heat at 4–6 times your individual trade risk. If you risk 1% per trade, your total open risk across all positions should not exceed 4–6% of your account at any one time. Here is why that matters in practice:
| Scenario | Individual Trade Risk | Open Positions | Total Portfolio Heat |
|---|---|---|---|
| Safe | 1% | 4 uncorrelated | 4% |
| Borderline | 1% | 5 correlated | Up to 10%+ effective |
| Dangerous | 1% | 6 correlated | Potential account ruin |
Correlation is the key word. If you are long EUR/USD, GBP/USD, and AUD/USD simultaneously, you are not holding three separate 1% trades. You are holding one large directional bet on USD weakness. When the dollar reverses hard, all three stops trigger at once. The illusion of diversification disappears instantly.
Practical steps to manage portfolio heat:
- Group your open trades by the underlying driver. Dollar trades, equity trades, and commodity trades each form their own risk bucket.
- Cap exposure per bucket at 2–3% total, regardless of how many individual trades sit inside it.
- When you add a new trade, check total heat first. If adding it pushes you past your cap, reduce an existing position or skip the new setup.
- Scaling into a winning position follows the same logic. Pre-planned clip sizing keeps total combined risk within your per-trade cap as you add to the position.
What are the four layers of a risk management framework?
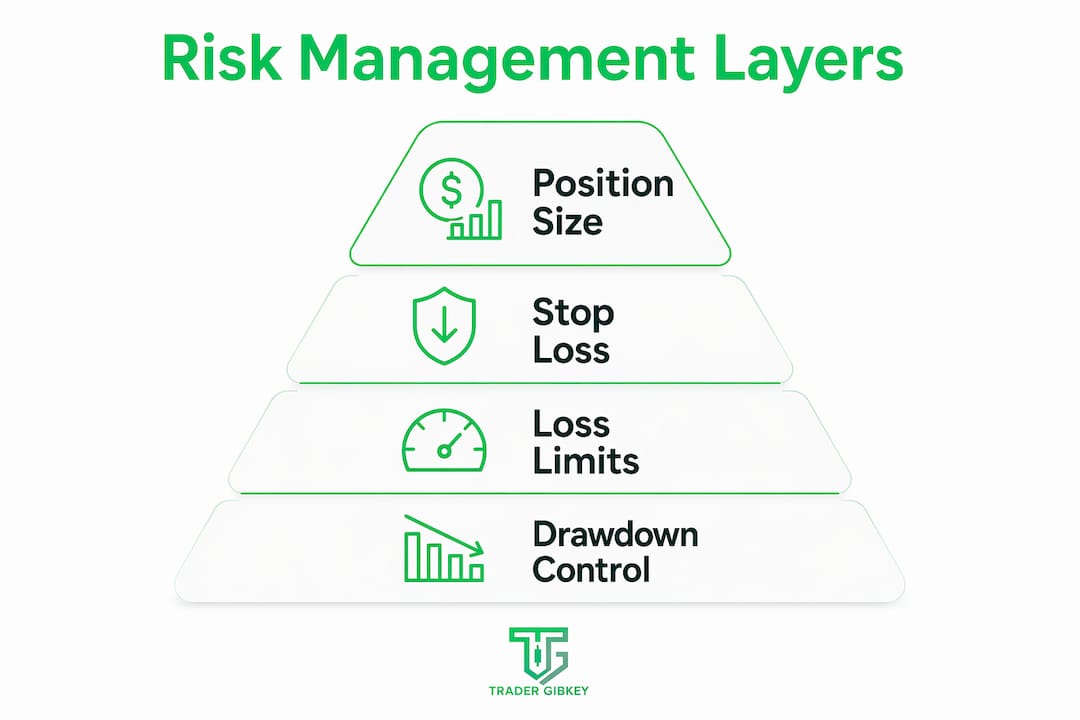
Position sizing is one layer of a four-layer risk management system. Skipping any layer increases your chance of account ruin, even if the other layers are solid.
Stop loss placement
Your stop must come from chart structure analysis, specifically prior swing highs and lows, support and resistance zones, and logical invalidation points. Round number stops and arbitrary dollar stops get hunted by liquidity-seeking price action. A structurally placed stop tells you exactly when your trade thesis is wrong.
Daily and weekly loss limits
Set a maximum loss you will accept in a single day, typically 2–3% of account. When you hit it, you stop trading for the day. No exceptions. This rule exists because losing streaks compress your judgment. The brain stops trading the chart and starts trading the pain. A daily limit forces a circuit breaker before emotional decisions compound the damage.
Drawdown management and phased responses
When your account draws down to a defined threshold, you respond in phases. The first phase is reducing position size by 50%. The second phase is pausing trading entirely and reviewing your setups. This is not weakness. It is the mechanical response that keeps you in the game long enough to recover. Traders who skip this layer often double down during drawdowns, which accelerates losses.
| Risk layer | What it controls | Consequence of skipping |
|---|---|---|
| Position sizing | Dollar risk per trade | Inconsistent exposure, oversizing |
| Stop loss placement | Trade invalidation point | Premature exits, emotional stops |
| Daily/weekly limits | Session-level loss cap | Revenge trading, tilt spirals |
| Drawdown management | Account-level recovery | Account ruin during losing streaks |
Pro Tip: Write your daily loss limit and drawdown thresholds into your trading plan before the session starts. A pre-committed rule is far harder to break than one you try to enforce in the moment.
Key Takeaways
Effective risk management and position sizing require a formula-driven approach, volatility awareness, portfolio heat monitoring, and layered controls working together to protect your capital across all market conditions.
| Point | Details |
|---|---|
| Use the universal formula | Calculate position size as (Account Size × Risk %) ÷ Stop Distance every single trade. |
| Size stops from chart structure | Place stops at swing highs/lows, not round numbers, to avoid liquidity hunts. |
| Apply ATR for volatile markets | Use 1.5–2.5x ATR as your stop distance to keep risk consistent across conditions. |
| Monitor total portfolio heat | Cap total open risk at 4–6% to avoid correlated losses compounding simultaneously. |
| Use all four risk layers | Sizing, stop placement, daily limits, and drawdown controls each serve a distinct protective role. |
Why I think most traders get position sizing backwards
After 18 years watching traders work through live market conditions, the pattern I see most often is this: traders treat position sizing as the last decision, not the first. They find a setup they like, they get excited, and then they figure out how many units to buy based on how confident they feel. That is the wrong order of operations entirely.
The sizing decision must come before the entry decision. When you calculate your position size first, you are forced to confront the real dollar risk of the trade. That confrontation is healthy. It filters out setups where the stop distance is too wide to take a meaningful position, and it stops you from oversizing on setups that feel “obvious.”
The other mistake I see constantly is averaging down. A trader enters a position, it moves against them, and they add more units to lower their average cost. What they are actually doing is increasing their exposure on a losing trade. That is the opposite of what the sizing formula tells you to do. The formula says your risk is fixed at entry. Averaging down breaks that rule and turns a controlled loss into a potential disaster.
Surviving a losing streak is the real edge. When you size correctly, a string of ten losing trades in a row still leaves you with 90% of your capital intact at 1% risk per trade. That survival gives you the time and the mental space to find your way back. Traders who oversize do not get that chance. They blow up before the market gives them an opportunity to recover. The trading performance review process reinforces this: the traders who improve fastest are the ones who track their sizing discipline as a metric, not just their win rate.
— Gabriel
Structured learning for traders who want to get this right
Understanding the theory of position sizing is one thing. Embedding it as a daily habit under real market pressure is another challenge entirely. Tradergibkey’s courses and mentorship programs are built around exactly that gap, teaching traders to apply risk management rules with the same discipline in a live session as they do in a calm study environment.

The Tradergibkey community gives you a structured environment where sizing decisions, stop placement, and portfolio heat management are reviewed as part of every trading session. You get feedback from traders who have applied these frameworks across 18 years of live Forex markets, not just backtested theory. If you are ready to move from knowing the formula to trusting it under pressure, start with Tradergibkey and build the foundation that keeps you in the game long term.
FAQ
What is the 1% risk rule in trading?
The 1% risk rule means you risk no more than 1% of your total account equity on any single trade. It protects your capital during losing streaks and keeps you trading long enough to recover.
How do I calculate position size correctly?
Use the formula: Position Size = (Account Size × Risk Percentage) ÷ Stop Distance. Your stop distance must come from chart structure, not an arbitrary dollar amount.
What is total portfolio heat?
Total portfolio heat is the combined dollar risk across all your open positions. The standard cap is 4–6% of your account to prevent correlated losses from triggering simultaneously and causing severe drawdowns.