
Smart Money Concepts (SMC) is a price-action framework built on one premise: institutions leave footprints, and you can trade them. Those footprints show up as liquidity pools, market structure shifts, order blocks, and Fair Value Gaps — not RSI divergences or moving average crossovers. If you can read those markers reliably, you stop chasing price and start anticipating it.
TL;DR — what to do right now on a demo chart:
- Mark market structure (swing highs and lows, HH/HL or LH/LL sequence)
- Mark liquidity pools (equal highs, equal lows, recent swing extremes)
- Mark order blocks and breaker blocks (last institutional candle before a strong move)
- Mark Fair Value Gaps and imbalances (price gaps between candles left unfilled)
Run that four-step checklist on every chart before you consider a setup. The annotated trade walkthroughs and the full demo-practice routine are in the sections below.
Table of Contents
- What are Smart Money Concepts, and why do institutions drive price?
- How do you read market structure, BOS, and CHoCH correctly?
- How do liquidity pools and sweeps work in SMC?
- What are order blocks, breaker blocks, and Fair Value Gaps?
- How does price rebalancing and mitigation actually work?
- What does a complete SMC trade setup look like, step by step?
- What mistakes do SMC traders make most often?
- Key Takeaways
- Why live mentorship shortens the SMC learning curve
- Tradergibkey gives you a structured path from theory to live execution
- Useful sources and further reading
- FAQ
What are Smart Money Concepts, and why do institutions drive price?
SMC reframes price action as the direct result of institutional order flow. Banks, hedge funds, and large proprietary desks move markets because their position sizes are too large to fill at a single price. They need liquidity — resting orders from retail traders — to build and unwind positions. That need shapes every significant price move you see on a chart.
The framework traces its lineage to Wyckoff’s accumulation/distribution cycles and the Inner Circle Trader (ICT) methodology, both of which center on the same idea: price moves to collect liquidity before trending. SMC adapts those principles into a structured set of markers any retail trader can apply.
The five core SMC elements:
- Market structure — the sequence of swing highs and lows (HH/HL in an uptrend, LH/LL in a downtrend) that defines directional bias
- Liquidity — clusters of resting stop orders at equal highs/lows and swing extremes that institutions target
- Order blocks (OBs) — the last bearish or bullish institutional candle before a significant displacement move
- Fair Value Gaps (FVGs) / imbalances — price gaps between candle bodies where the market moved too fast to fill both sides of the order book
- Mitigation / rebalancing — the tendency of price to return to unfilled imbalances or prior OBs before continuing
Where SMC differs from conventional retail analysis is in what it deprioritizes. Lagging indicators like RSI, MACD, and Bollinger Bands describe what price already did. SMC asks where institutions need to go next, based on where liquidity sits and what structure says about bias.
Real trading costs still matter, regardless of your methodology. Broker pricing and execution quality directly affect your net edge on every trade.

| Factor | Why it matters for SMC traders |
|---|---|
| Commission structure | Zero-commission equity platforms reduce friction on frequent setups |
| Margin rates | Higher margin costs erode edge on swing trades held overnight |
| Platform execution | Slippage at order block entries can shift a positive-expectancy setup negative |
| Charting tools | Clean, uncluttered charts make structure and FVG marking faster and more accurate |
How do you read market structure, BOS, and CHoCH correctly?
Market structure is the backbone of every SMC decision. Before you mark a single order block or liquidity pool, you need to know what direction the market is structured to move. Without that, you are marking zones in a vacuum.
The four structural states:
- Higher High / Higher Low (HH/HL): bullish structure — bias is long
- Lower High / Lower Low (LH/LL): bearish structure — bias is short
- Break of Structure (BOS): price takes out a prior swing high (in an uptrend) or swing low (in a downtrend), confirming the existing trend continues
- Change of Character (CHoCH): price breaks the opposite structural point — a swing low in an uptrend, or a swing high in a downtrend — signaling a potential reversal
The distinction between BOS and CHoCH is where most traders slip up. A BOS is continuation. A CHoCH is the first warning that the trend is losing control. Neither is a trade signal on its own; both are filters that tell you which direction to look for entries.
Internal vs. external structure
External structure lives on the higher timeframe (HTF) — the weekly or daily chart. It defines the macro bias. Internal structure lives on the lower timeframe (LTF) — the 1-hour or 15-minute chart. It shows the micro moves institutions use to build positions inside the larger trend.
The rule is simple: trade internal structure in the direction of external structure. If the daily chart is in a bullish HH/HL sequence, you look for LTF CHoCH to the upside after a liquidity sweep, not short setups.
Practical marking rules:
- Draw swing highs and lows from significant turning points, not every minor wick
- A structure level is invalidated when price closes beyond it on the same timeframe you drew it on
- Align at least two timeframes before committing to a directional bias
Pro Tip: Before entering any setup, confirm that the BOS you are trading left a visible liquidity pool (equal highs or equal lows) on the same side. A BOS without a liquidity pool nearby is a weaker signal — institutions are less likely to defend a zone that has no resting orders to absorb.
How do liquidity pools and sweeps work in SMC?
Liquidity is not just a concept in SMC — it is the reason price moves where it does. Institutions cannot fill large orders at a single price without moving the market against themselves. So they engineer moves toward clusters of resting orders, fill their positions there, and then reverse.
The core liquidity principle: Price does not move randomly to swing highs and lows. It moves there because that is where stop orders and pending entries cluster. When institutions need to buy, they push price up to sell-side liquidity (stops above equal highs). When they need to sell, they push price down to buy-side liquidity (stops below equal lows). The sweep is the fill mechanism, not the trend.
Visible vs. latent liquidity:
- Visible liquidity sits at obvious levels — equal highs, equal lows, prior swing extremes, and round numbers. These are the levels every retail trader can see, which is exactly why they attract institutional targeting.
- Latent liquidity is less obvious — option strikes, institutional order clusters, and off-chart accumulation zones. You cannot mark latent liquidity directly, but you can infer it from price behavior at visible levels.
How to spot a genuine liquidity sweep
A sweep is not just a wick. Look for these confirmation signals before treating a move as a genuine institutional liquidity grab:
- Price wicks beyond the equal high/low and closes back inside the range within the same candle or the next
- The sweep is followed by a strong displacement candle in the opposite direction
- A CHoCH forms on the lower timeframe shortly after the sweep
- Volume (if available on your platform) spikes during the wick, then drops as price reverses
Normal volatility produces wicks too, but they lack the displacement and structural follow-through. If price sweeps a level and then grinds sideways without a clean reversal candle, treat it as noise until structure confirms otherwise.
What are order blocks, breaker blocks, and Fair Value Gaps?
These three markers are where SMC setups actually originate. Understanding how to mark them correctly separates traders who use SMC as a vague concept from those who execute it with precision.
One-line definitions:
- Order block (OB): the last bearish candle before a bullish displacement (bullish OB), or the last bullish candle before a bearish displacement (bearish OB) — the candle where institutional orders were placed
- Breaker block: a former OB that price has since broken through and invalidated; it often flips polarity and acts as resistance (former support) or support (former resistance)
- Fair Value Gap (FVG) / imbalance: a three-candle pattern where the wick of candle 1 and the wick of candle 3 do not overlap, leaving an unfilled gap in the order book
Rules for marking a valid order block:
- The OB must precede a significant displacement move, not a minor push
- The displacement should break at least one structural level (internal BOS or CHoCH)
- Higher-timeframe OBs carry more weight than lower-timeframe ones
- An OB is invalidated when price closes through it without a reaction
FVGs form because price moved so fast that the market could not match buyers and sellers across the full range. That imbalance acts as a magnet — price tends to return to fill it before continuing in the original direction. This is the rebalancing behavior that makes FVGs tradeable.
Practical entry ideas:
- Enter at the 50% level of an OB (the “equilibrium” of the block) with a stop below the full OB range
- For FVGs, wait for price to enter the gap and show a rejection candle before entering
- Combine OB entries with a confirmed LTF CHoCH for higher-probability timing
Pro Tip: Not every marked OB or FVG is worth trading. Filter by asking three questions: Does HTF structure support this direction? Is there a liquidity pool nearby that was recently swept? Did price show a clear reaction (rejection candle or CHoCH) when it entered the zone? If you cannot answer yes to all three, skip it.
How does price rebalancing and mitigation actually work?
Mitigation is one of the most misunderstood behaviors in SMC, and getting it right changes how you manage trades. The idea is straightforward: when institutions place orders in a zone (an OB or FVG), they often need to return to that zone to fully fill their position before the trend continues. That return is mitigation.
Think of it this way. A large fund cannot buy 10,000 contracts at one price. They buy some, price moves up, and then they engineer a pullback to the original zone to buy the rest. That pullback looks like a retracement on your chart. It is actually a second entry opportunity.
Three common price reactions at institutional footprints:
- Quick rejection: price enters the OB or FVG, prints a sharp reversal candle, and moves away fast. This is the cleanest reaction and the easiest to trade.
- Slow absorption: price grinds through the zone without a clear rejection. This often means the zone is being consumed, not defended. Treat it as a warning to reduce size or wait for a cleaner reaction.
- False break then continuation: price wicks slightly beyond the OB or FVG (a stop hunt), then reverses strongly. This is the most powerful reaction but requires patience to wait for the reversal confirmation.
Checklist when a footprint zone is approached:
| Check | What to look for |
|---|---|
| Timeframe alignment | HTF structure supports the direction of the trade |
| Liquidity presence | A liquidity pool was swept before price entered the zone |
| Structural confirmation | LTF CHoCH or BOS formed inside or near the zone |
| Candle reaction | Rejection wick, engulfing candle, or displacement from the zone |
Journaling mitigation events: every time price approaches an OB or FVG you marked, log whether it reacted, how it reacted, and what the structure looked like at the time. After 30 logged events, patterns in your own marking accuracy will become visible. That data is more useful than any generic win-rate statistic.

What does a complete SMC trade setup look like, step by step?
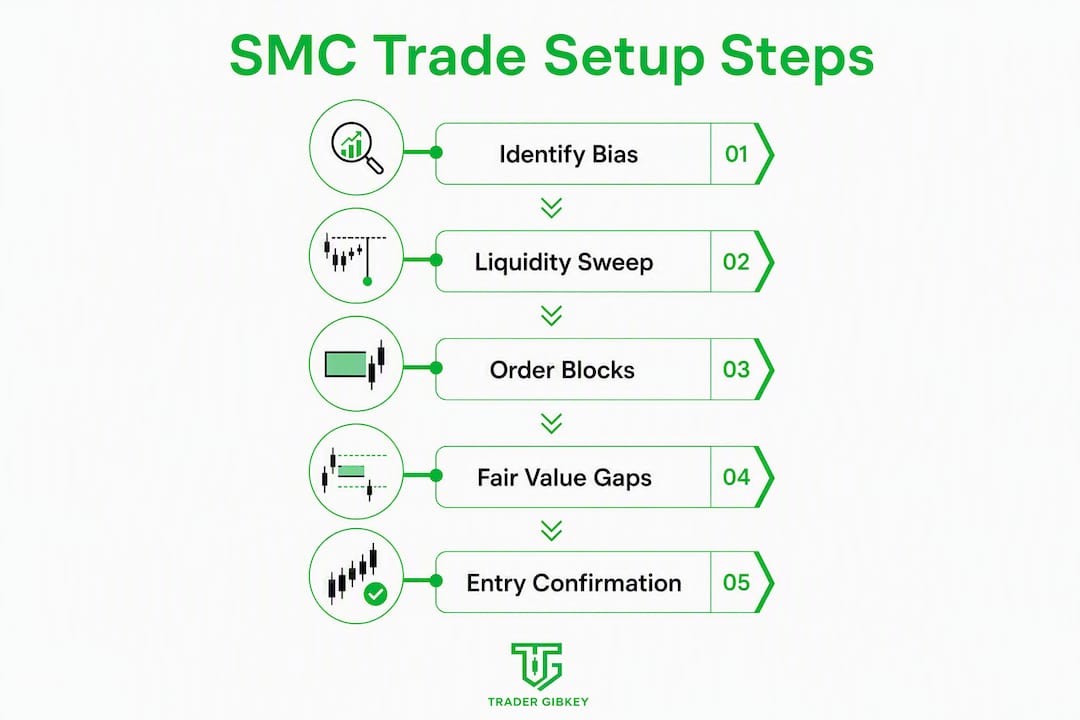
The most repeatable SMC setup follows a consistent sequence: HTF structure defines bias, a liquidity sweep clears the path, and an OB or FVG on the LTF provides the entry zone with a confirmed rejection.
Here is the full checklist.
Step-by-step SMC trade setup:
- Establish HTF bias. Check the daily or 4-hour chart. Is price in a bullish HH/HL sequence or bearish LH/LL? This is your directional filter — only take trades in this direction.
- Identify the nearest liquidity pool. Mark equal highs (for shorts) or equal lows (for longs) on the HTF. These are your targets for the sweep.
- Wait for the liquidity sweep. Price should wick into or through the liquidity pool and close back inside the range. This is the institutional fill.
- Confirm a CHoCH on the LTF. After the sweep, drop to the 15-minute or 1-hour chart. Look for a Change of Character — a break of the most recent swing low (for longs) or swing high (for shorts) in the opposite direction.
- Locate the entry zone. Find the OB or FVG that formed during the displacement move that caused the CHoCH. This is your entry zone.
- Wait for price to return to the zone. Do not chase. Let price pull back into the OB or FVG.
- Confirm entry. Look for a rejection candle (pin bar, engulfing, or displacement candle) inside the zone before entering.
- Place your stop. Set the stop below the full OB range (for longs) or above it (for shorts), plus a small buffer for spread/slippage.
- Define your target. The first target is the nearest liquidity pool in the direction of the trade. The second target is the HTF structural level.
- Scale out. Take partial profit (50%) at the first target, move stop to breakeven, and let the remainder run to the second target.
On annotated trade reviews: the fastest way to internalize this sequence is to review real trades with markup — not just watch someone else’s screen. Mentor-guided annotated examples show exactly which decision points mattered and which were noise, cutting the feedback loop from months to weeks.
Pro Tip: For accounts under $10,000, stick to the 15-minute and 1-hour charts for entries. The 4-hour and daily charts define bias. Smaller accounts need tighter stops, and lower timeframes give you more precise OB entries. Larger accounts can absorb wider stops on the 4-hour chart and often get cleaner, less-hunted setups.
Practicing this sequence on a demo account before risking real capital is not optional — it is the only way to know whether your marking is consistent enough to produce an edge.
What mistakes do SMC traders make most often?
The three most common mistakes are over-trading marked zones, ignoring HTF structure, and using lagging indicators as primary entry signals. Each one is fixable, but only if you recognize it first.
Mistake 1: Over-trading every marked zone. Marking an OB or FVG does not make it tradeable. Traders who mark every zone on every timeframe end up with charts so cluttered that every price move “confirms” something. The fix is the three-question filter from the order block section: structure, liquidity, and reaction. If all three are not present, the zone does not qualify.
Mistake 2: Ignoring HTF structure. Taking a long setup on the 15-minute chart while the daily is in a clear LH/LL sequence is one of the fastest ways to lose consistently. HTF structure is not a suggestion — it is the directional filter that determines which setups you are even allowed to consider.
Mistake 3: Using RSI, MACD, or moving averages as primary entry signals. These tools describe past price action. SMC indicator overlays can auto-mark structure and OBs as study aids, but when a lagging indicator becomes the reason you enter a trade, you have abandoned the institutional-footprint logic that makes SMC work.
The confirmation trap: adding more indicators to “confirm” an SMC setup usually does the opposite — it creates false confidence and delays entries past the optimal zone. The best SMC traders use price action and structure alone for entry decisions, then check a secondary indicator (like volume or a simple ATR for stop sizing) only after the setup is already qualified.
A practical filter checklist before any entry:
- HTF bias confirmed (HH/HL or LH/LL sequence intact)
- Liquidity pool swept on the relevant timeframe
- Clear BOS or CHoCH on the LTF
- Price reaction visible at the OB or FVG (not just price touching the zone)
- No conflicting HTF structure directly overhead (for longs) or below (for shorts)
Keep your setup rules to five or fewer filters. Test each one in demo for at least 20 trades before adding another. Complexity does not improve edge — it obscures it.
Key Takeaways
SMC trading works because it reads institutional footprints — liquidity, structure, order blocks, and Fair Value Gaps — rather than lagging indicators, and the most repeatable setups combine all four markers in a structured sequence.
| Point | Details |
|---|---|
| Four-step chart checklist | Mark structure, liquidity pools, order blocks/breakers, and FVGs before evaluating any setup. |
| HTF structure is the filter | Only trade setups that align with the higher-timeframe HH/HL or LH/LL sequence. |
| Liquidity sweeps precede entries | Wait for a confirmed sweep of a liquidity pool before entering at an OB or FVG. |
| Journal every mitigation event | Log 30+ zone reactions to identify patterns in your own marking accuracy and refine expectancy. |
| Tradergibkey mentorship | Tradergibkey’s live sessions and annotated trade reviews accelerate SMC skill transfer beyond solo study. |
Why live mentorship shortens the SMC learning curve
Most traders who struggle with SMC are not struggling with the concepts. They understand what an order block is. What they cannot do is mark one consistently in real time, under pressure, on a live chart. That gap between knowing and doing is where solo video consumption fails and structured mentorship delivers.
The reason is feedback latency. When you watch a recorded video, you get no signal about whether your own marking is accurate. You might be drawing OBs on the wrong candle for six months and never know it. A live session with an experienced mentor catches that error in the first week.
Gabriel brings over 18 years of live forex market experience to every session at Tradergibkey. The mentorship format is built around annotated trade reviews and live market walkthroughs — not slide decks. Students see real decisions made in real time, with the reasoning explained as price moves. That format compresses the feedback loop in a way that passive content simply cannot replicate.
Community practice formats add another layer. When you discuss your trade rationale with peers who are also applying SMC, you catch logical gaps in your own thinking that you would never notice alone. Accountability and peer review are not soft benefits — they are measurable accelerants to skill acquisition.
How to judge a mentor before paying:
- Ask for a sample live session or a recorded walkthrough with real-time commentary (not a polished post-trade recap)
- Check whether the community is active and whether members post their own marked charts for review
- Look for annotated examples that show mistakes and corrections, not just winning trades
A mentor who only shows winning setups is teaching you a highlight reel. The learning happens in the corrections.
Tradergibkey gives you a structured path from theory to live execution
Reading about SMC and trading it profitably are two different skills. Tradergibkey’s mentorship program is built for the gap between them: live market sessions where you watch institutional footprints form in real time, annotated trade reviews that show exactly which markings mattered, and a structured demo routine so you build a repeatable process before risking a dollar.

The program includes daily market analysis, journaling templates, risk management training, and a private community where members review each other’s charts. You get real-time feedback on your marking accuracy — the one thing no video course can give you.
Students who come in with some SMC knowledge but no consistent edge typically find their marking accuracy and setup selection sharpen significantly within the first few weeks of live sessions. The structure does the work that willpower alone cannot.
If you are ready to move from marking charts in isolation to trading with a system and a community behind you, start with Tradergibkey’s mentorship program and see what guided practice actually feels like.
Useful sources and further reading
The resources below are worth bookmarking as you build your SMC practice routine.
- Smart Money Concepts SMC for Beginners: 2026 Guide | Tradergibkey — the companion primer to this article, with additional chart examples and concept breakdowns
- Mentor-Guided Trade Analysis: 3 Annotated Examples | Tradergibkey — real trade walkthroughs with markup; read this alongside the setup checklist above
- Why Traders Need Practical Experience to Succeed | Tradergibkey — the case for demo-first practice and how to structure your first 30 days
- What Is Trading Mentorship and Why It Matters | Tradergibkey — a deeper look at mentorship formats and what to expect from structured feedback
- Forbes Advisor — Best Online Brokers and Trading Platforms — for comparing execution quality, margin rates, and platform reliability before choosing where to trade
Where to start: open the SMC Beginners Guide first, then work through the annotated trade examples. Run the four-step chart checklist from this article on 10 demo charts before your next live session. That sequence builds the marking habit faster than any amount of reading alone.
This article is general educational information, not financial or investment advice. Confirm current regulations, broker terms, and risk disclosures with the relevant primary sources or a qualified financial professional before trading.
FAQ
What is SMC trading in simple terms? SMC (Smart Money Concepts) is a price-action method that tracks institutional order flow through liquidity pools, market structure, order blocks, and Fair Value Gaps to find high-probability trade entries.
How long does it take to learn SMC trading? Most traders need several months of consistent demo practice to mark setups reliably. Live mentorship with annotated feedback typically shortens that timeline significantly.
Can beginners use SMC trading strategies? Yes, but start with market structure and liquidity before adding order blocks and FVGs. Build the checklist one layer at a time in a demo account before trading real capital.