
Call your daily bias from the daily and 4H structure plus the nearest liquidity draw, then trade only setups that align with it. If order flow, imbalance, and the draw on liquidity all point the same direction, you have a bias worth trading. If they conflict, the correct move is neutral. Skip the day, or size down until the picture clears. The full checklist for making that call lives just below.
TL;DR:
- Daily bias should only be traded when order flow, imbalance, and liquidity draw align in the same direction; conflicting signals call for neutrality.
- Accurate bias setting requires analyzing market structure, unfilled imbalances, previous day and session ranges, and nearby liquidity levels before entering trades.
- Proper marking of fair value gaps and liquidity zones depends on discipline, timeframe color-coding, and avoiding over-interpretation of outdated or low-timeframe setups.
- Entry confirmation on lower timeframes relies on a market structure shift, retests, or rejection candles, with stops placed relative to structure, not arbitrary levels.
- Avoid trading during consolidation, choppy ranges, or high-impact news if the technical bias isn’t clear, and always journal confidence levels and core signals to improve gap recognition.
Table of Contents
- What Is Daily Market Bias in Forex and Why It Changes Your Odds
- How Do You Set Your Daily Bias Step by Step?
- Marking Order Flow, Liquidity Zones, and Fair Value Gaps Correctly
- Confirming Entries on Lower Timeframes
- Where Daily Bias Calls Go Wrong (And How to Protect Your Capital)
- Two Worked Examples: Bullish Day vs Neutral Day
- Why Trader Gibkey’s Approach to This Workflow Holds Up
- Do Daily Bias Rules Change Across Currency Pairs?
- When I Sit Out and How I Journal a Bias Call
- Ready to Trade Your Bias With a Structured System?
- Sources
What Is Daily Market Bias in Forex and Why It Changes Your Odds
Daily market bias is your strategic read on which way a currency pair is most likely to move over the coming session. Bullish, bearish, or neutral. It is not a prediction of every candle. It is a filter that tells you which setups deserve your attention and which ones you should ignore entirely. TradingView’s breakdown of setting a daily bias frames it exactly this way: a tool for prioritizing high-probability setups, not a crystal ball.
Here’s why this matters more than most new traders realize. The daily and 4H timeframes carry the fingerprints of institutional order flow. Big positions don’t get built and unwound in five minutes. They leave tracks across hours and sessions, and those tracks show up as structure. Higher highs and higher lows, or lower highs and lower lows. When you read that structure correctly before the London or New York open, you stop reacting to every 5 minute wiggle and start trading with the current, not against it.
The payoff shows up in three concrete ways once you build this into your routine:
- Better filtering. You stop taking every setup that looks decent on the 5 minute chart and only act on the ones matching your bias.
- Smarter risk placement. Knowing the higher timeframe context tells you where a stop actually makes sense, instead of guessing.
- Fewer losing trades from fighting the trend. Most avoidable losses come from taking a countertrend scalp because it “felt” right in the moment.
Trading psychology forex struggles almost always trace back to this exact gap. No bias means no filter, and no filter means every shiny setup looks tradeable.
How Do You Set Your Daily Bias Step by Step?
This is the checklist. Run it every morning before you touch a chart smaller than the 15 minute. It takes ten to fifteen minutes once it becomes habit.
- Read the daily and 4H market structure. Mark higher highs and higher lows for an uptrend, or lower highs and lower lows for a downtrend. If price is choppy with no clear sequence, note that too. It matters later.
- Map unfilled imbalances and fair value gaps. Look for FVGs left behind on the daily and 4H, along with obvious supply and demand zones that haven’t been tested yet. These act as magnets for price.
- Mark the previous day’s close, the Asian session range, and recent session extremes. The previous day close and Asian range give you a reference frame most retail traders skip entirely, and it is often where the real story of the day starts.
- Identify the nearest draw on liquidity above and below current price. This is the level the market is most likely reaching for. Old highs, old lows, or a resting pool of stops. Understanding what liquidity actually means in this context changes how you read every chart afterward.
- Check the economic calendar for high-impact events and rate your confidence by learning about how to forecast exchange rates. A systematic approach to daily bias treats bias as confidence-weighted, not binary. Strong, moderate, developing, or neutral. A red-flag event like a Fed statement or NFP release should lower your confidence even if the technical picture looks clean.
- Confirm on lower timeframes before entering. Wait for a market structure shift, a retest of your zone, or a rejection candle on the 15 minute or 30 minute chart. This is where you actually pull the trigger.
The decision rule is simple, and it’s the part traders skip when they’re impatient. All three core signals, order flow, imbalance, and draw on liquidity, need to point the same direction for a valid bias. If two agree and one conflicts, that’s a lower-confidence bias and calls for reduced size. If they genuinely conflict, the answer is neutral. Not “slightly bullish.” Neutral.
Practical guides on identifying daily bias, including RebelsFunding’s five-signal method, recommend layering in momentum tools like a 200 day moving average or VWAP as extra confirmation once the core three signals align. Treat those as tiebreakers, not primary inputs.
Pro Tip: Write your bias down before London opens, in one sentence, with your confidence level attached. “Bullish, moderate confidence, watching the 1.0850 FVG as the draw on liquidity.” If you can’t write that sentence cleanly, you don’t have a bias yet. You have a guess.
Marking Order Flow, Liquidity Zones, and Fair Value Gaps Correctly
This is where most daily bias calls fall apart, not because the concept is wrong, but because the marking is sloppy.
Reading order-flow direction comes down to a simple structural test. On the daily and 4H, is price consistently closing above prior swing highs (bullish structure) or below prior swing lows (bearish structure)? A single higher high doesn’t confirm a trend. You want at least two consecutive higher lows holding before you call it bullish structure with any confidence.
Marking fair value gaps takes more discipline than most tutorials suggest. An FVG forms when a three-candle sequence leaves a gap between candle one’s wick and candle three’s wick, usually during an impulsive move. The detailed mechanics of trading FVGs matter here because gaps act as imbalance in the market. Price often returns to fill them before continuing in the original direction. An unfilled daily FVG sitting above current price is a strong argument for bullish continuation. One below argues the opposite. Related concepts like the inversion fair value gap come into play when a gap fails and flips polarity, which is a signal worth tracking separately from a standard FVG.
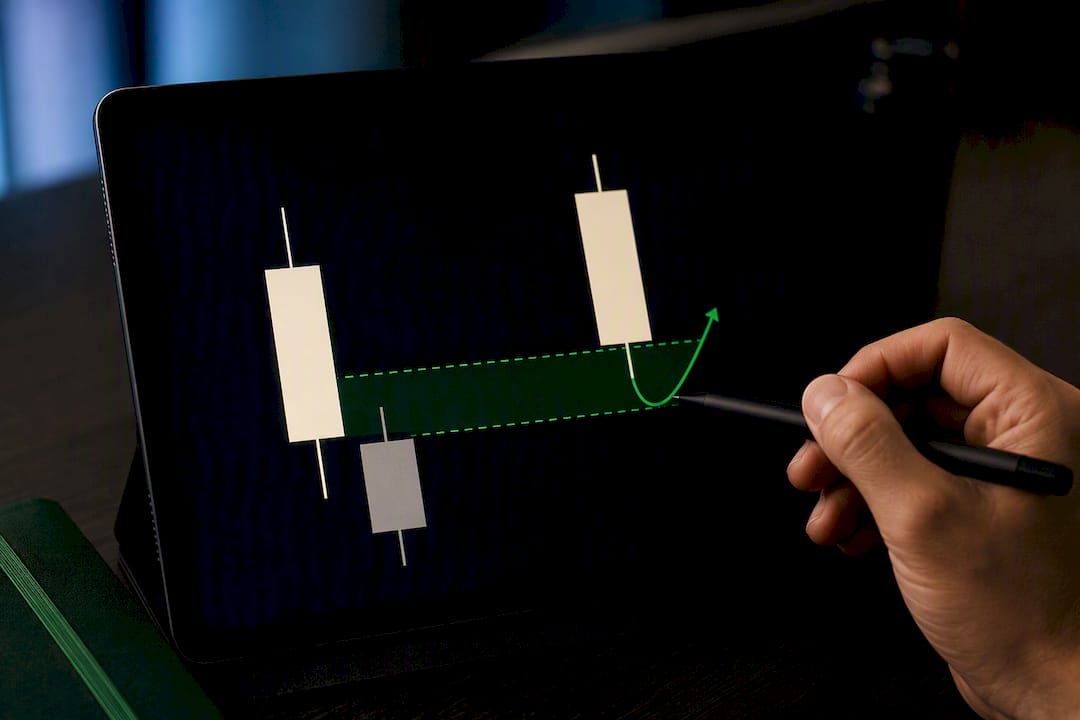
The draw on liquidity is the single most underused concept in retail trading. Price doesn’t move randomly. It tends to move toward pools of resting orders, old session highs, equal lows, untested swing points, because that’s where the volume needed to fill large orders actually sits. Understanding how liquidity sweeps trap retail traders explains why price often spikes through an obvious level before reversing hard. If your nearest draw on liquidity sits above price and your structure is bullish, that alignment is a genuine signal. If your nearest draw sits below price while structure looks bullish, you have a conflict worth pausing on.
Common mistakes that wreck this process:
- Overmarking the chart. If you have twelve zones drawn, none of them mean anything. Mark the three or four that actually matter.
- Using low-timeframe noise as a signal. An FVG on the 1 minute chart is not the same weight as one on the daily. Keep your bias inputs on daily and 4H only.
- Ignoring zone age. A demand zone from six months ago carries far less weight than one from last week. Fresh zones matter more.
- Confusing a filled gap with an active one. Once price has traded through an FVG, it’s done its job. Stop treating it as live support or resistance.
Pro Tip: Color code your zones by timeframe, daily zones in one color, 4H in another. When you glance at the chart and see three colors stacked in the same area, that’s real confluence. One color repeated five times just means you’ve been marking the same timeframe over and over.
Confirming Entries on Lower Timeframes
Your daily bias tells you direction. It does not tell you when to click buy or sell. That job belongs to the 15 minute or 30 minute chart, and skipping this step is how a correct bias still turns into a bad trade.
- Wait for a market structure shift (MSS). On your execution timeframe, this means price breaks a recent swing high (in a bullish bias) or swing low (in a bearish bias) with a clean, decisive close, not a wick that barely pokes through.
- Look for one of three entry patterns. A retest of the zone that caused the MSS, a rejection candle at a key level, or an optimal trade entry (OTE) pullback into the 62 to 79 percent retracement of the recent impulse leg.
- Place your stop relative to structure, not to a round number. A few pips beyond the zone or the swing point that invalidates your read, never an arbitrary distance chosen because it “feels safe.”
- Size the position using a fixed percentage rule. Risking a consistent 0.5 to 1 percent of account equity per trade keeps one wrong bias call from doing real damage.
This is the step where market sentiment forex chatter on social media becomes irrelevant. You already have your bias. You already have your zones. Now you’re just waiting for price to confirm it on the timeframe where you actually pull the trigger.
Where Daily Bias Calls Go Wrong (And How to Protect Your Capital)
The single most expensive mistake in this entire process is forcing a bias on a day that doesn’t have one. Consolidation days, choppy ranges, pre-news drift, these conditions produce false signals constantly, and traders who insist on calling “bullish” or “bearish” anyway end up getting chopped apart by whipsaws. Neutral is a legitimate answer, and treating it that way protects your account far more than any clever entry technique.
Know when to flip or drop a bias entirely:
- A clean structural break against your bias on the 4H, not just a wick, but a full-bodied close beyond the level that defined your original read.
- Price closing decisively through your key zone rather than just tagging it and bouncing.
- A high-impact news event that contradicts your technical picture. Central bank commentary can override structure fast, and ING’s FX analysis shows how quickly directional odds shift around rate expectations and macro data.
Risk rules that actually hold up under pressure:
- Cap risk at 0.5 to 1 percent of equity per trade, full stop, no exceptions on “high confidence” days.
- Scale into a position only after your bias has been confirmed by an MSS on the lower timeframe, never before.
- Cut your position size in half, or skip entirely, the moment two of your three core signals stop agreeing.
Pro Tip: If you find yourself justifying a bias with a fourth or fifth indicator because the first three didn’t quite line up, that’s your signal to walk away. Confluence supports a decision. It shouldn’t be manufacturing one.
Two Worked Examples: Bullish Day vs Neutral Day
Example A: A bullish bias day. Daily structure showed two consecutive higher lows over the prior week, confirming an uptrend. An unfilled daily FVG sat roughly 80 pips above current price, and the nearest draw on liquidity was a swing high from three sessions earlier sitting just above that gap. All three signals lined up: bullish structure, an unfilled gap pulling price upward, and liquidity resting above. The Asian session held a tight range near the previous day’s close, which added a fourth piece of context. On the 15 minute chart, price swept the Asian low, then printed a bullish MSS through the London open. Entry came on the retest of that breakout zone, stop placed just under the swept low, and the trade ran into the daily FVG before hitting the liquidity pool above.
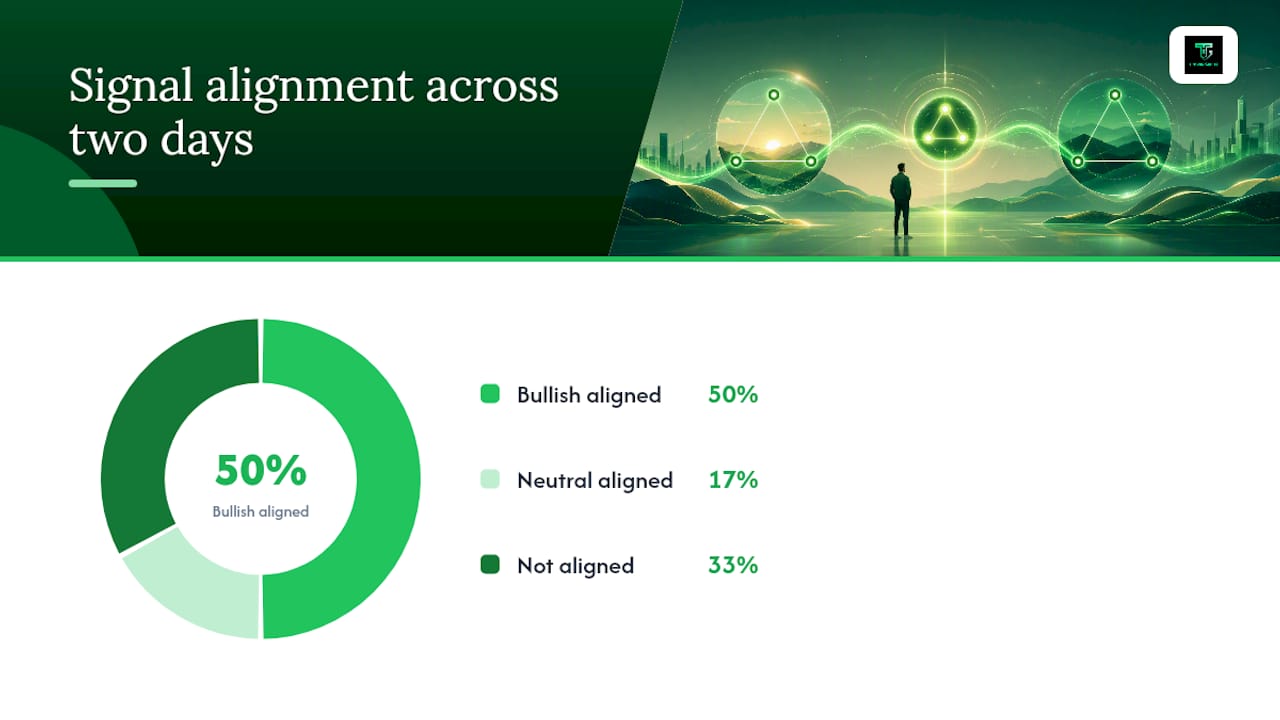
Example B: A neutral day. Daily structure looked bullish on paper, higher highs intact, but the nearest draw on liquidity actually sat below current price, at an untested low from the prior week. That’s a direct conflict between structure and liquidity. Rather than forcing a long, the correct call was neutral, with size reduced to zero for new setups until the picture cleared. Price chopped for most of the session before eventually sweeping the lower liquidity pool late in the day, confirming the neutral call had been the right one.
What to log in your journal after each:
- Which of the three core signals aligned and which didn’t.
- Your confidence rating at the time of the call, not after you saw the outcome.
- Whether the entry pattern (MSS, retest, rejection) actually triggered cleanly or you forced it.
Why Trader Gibkey’s Approach to This Workflow Holds Up
This checklist reflects the same order-flow and liquidity framework Trader Gibkey has built training around, drawing on more than 18 years of live market experience rather than recycled theory. The emphasis throughout has been on price action that traders can actually verify on their own charts, not indicator stacks that promise certainty they can’t deliver.
Students moving through this training describe a consistent shift: starting as reactive, indicator-dependent traders and ending up making structured, confidence-rated bias calls they can defend and journal. The program walks through this checklist, daily structure, liquidity, FVGs, lower-timeframe confirmation, in real market conditions.
Do Daily Bias Rules Change Across Currency Pairs?
The core workflow stays identical across pairs, but confidence levels and reliability shift depending on what you’re trading. Major pairs like EUR/USD and GBP/USD tend to respect structure and liquidity concepts more cleanly because deeper liquidity means less erratic, noise-driven movement. Order flow reads tend to hold up better on these pairs simply because there’s more volume behind every move.
Cross pairs and exotic pairs behave differently. A pair like GBP/JPY carries higher volatility and wider spreads, which means fair value gaps form more often but also get invalidated more often. Bias calls on crosses generally deserve a lower confidence rating by default, even when all three signals technically align, because the noise floor is higher.
Commodity-linked currencies, AUD/USD, NZD/USD, USD/CAD, add another layer. These pairs often move on data tied to commodity prices as much as on pure technical structure. A gold rally can push AUD/USD in ways that have nothing to do with the daily FVG you marked that morning. For these pairs, weighting your macro check a little heavier than usual, checking commodity price action alongside the economic calendar, tends to improve accuracy.
USD pairs during major USD-driving events, Fed decisions, CPI releases, deserve special caution regardless of pair. The dollar’s role as the base or quote currency in nearly every major pair means a single high-impact release can override technical bias entirely, which is exactly why the calendar check sits inside the workflow rather than as an afterthought.
When I Sit Out and How I Journal a Bias Call
I skip the day more often than people expect. If the daily FVG, the structure, and the draw on liquidity don’t all point the same way, I’m not trading, no matter how clean the lower timeframe setup looks. Forcing a trade on a conflicted bias is how good traders build bad habits.
The journaling prompt I keep coming back to: “What would have to happen for this bias to be wrong?” Write the answer down before you enter, not after you’ve lost.
Patience isn’t the exciting part of trading. It’s the part that keeps you in the game long enough for the good setups to actually show up.
— Gabriel
Ready to Trade Your Bias With a Structured System?
Reading structure, liquidity, and FVGs correctly takes repetition, and most traders lose money in the exact window between learning the concept and building the pattern recognition to trust it live. This is where mentorship can be valuable. Programs may walk you through this daily bias workflow in real market sessions, helping refine your zone marking and structure reads until the process becomes second nature.

Community offerings often include daily market analysis based on this checklist, live trading sessions demonstrating bias calls in real time, and structured courses covering price action, risk management, and trading psychology. Many students report a shift from uncertainty to making more confident, defensible calls they can explain.
If you’re ready to stop guessing at direction and start applying a repeatable process, visit the Tradergibkey landing page to see current course and mentorship options and find the format that fits where you are right now.
Sources
- Forex Day Trading: Setting a Bias for the Day — TradingView
- MRKT Edge — Daily Bias
- 5 Ways to Identify Daily Bias & Use it to your Trading Advantage — RebelsFunding
- FX Daily: Risks skewed to a stronger dollar — ING THINK