
The most effective XAUUSD trading strategy starts with a macro-first read: check the US dollar (DXY) direction, then real yields (inflation-adjusted Treasury yields), then risk sentiment — and only then execute price-action setups during high-liquidity sessions. For timeframes, scalping works on M1–M5 with tight, momentum-driven micro setups; day trading fits M15–H1 for session breakouts and retests; swing trading belongs on H4–Daily with a 200 EMA directional filter. Your hard risk rule: never risk more than a small, prudent percentage of account equity per trade, with stops sized to ATR or structural invalidation, not arbitrary pip counts.
Key Takeaways
The most effective XAUUSD trading strategy combines a macro-first bias (DXY + real yields), session-aware execution (London and New York), and strict ATR-based risk management applied consistently across every timeframe.
| Point | Details |
|---|---|
| Macro bias first | Check DXY direction, then real yields, then risk sentiment before touching the chart. |
| Session timing matters | London open and London–NY overlap deliver the best liquidity, tightest spreads, and most reliable directional moves. |
| ATR-based stops only | Never use fixed pip stops; size stops to 1–2x ATR(14) or structural invalidation on your execution timeframe. |
| Risk 1–2% per trade | Apply a hard daily loss limit of 3–4% and reduce size by 30–50% during high-volatility news events. |
| Tradergibkey mentorship | Structured live sessions, journaling templates, and real-time trade reviews close the gap between knowing a strategy and executing it consistently. |
Table of Contents
- Why trade XAUUSD? Core market characteristics you need to know
- What actually moves gold: macro, fundamental, and market drivers
- What are the best XAUUSD strategies and when should you use each?
- How to trade XAUUSD with trend-following: step-by-step swing setup
- How to trade price action at support and resistance levels
- Breakout strategies and session-based setups for XAUUSD
- Scalping XAUUSD: micro setups, execution, and cost management
- Smart Money Concepts for XAUUSD: liquidity sweeps, FVGs, and confirmation
- Range and mean-reversion setups: when gold is not trending
- Multi-timeframe alignment and trade management in XAUUSD
- Indicators and correlation filters that sharpen XAUUSD signals
- Risk management and position sizing for XAUUSD: formulas and worked examples
- Trader Gibkey validated setups and live trade examples
- Pre-trade execution checklist and the best times to trade XAUUSD
- Sources
- FAQ
Why trade XAUUSD? Core market characteristics you need to know
Gold against the US dollar is one of the most actively traded instruments in the world. That status comes with real advantages for retail traders, but also specific challenges you need to respect before you commit capital.
What makes XAUUSD attractive:
- Liquidity and spreads. During the London and New York sessions, XAUUSD spreads on major brokers are generally at their tightest, typically under a pip in gold-price terms. Outside those windows, spreads widen and fills deteriorate.
- Intraday range. Gold routinely moves an average range of several dollars per ounce on a normal trading day, and on high-impact news days that volatility can increase significantly. That volatility creates real edge for both scalpers and swing traders.
- Safe-haven demand. During geopolitical crises or equity sell-offs, gold attracts fast, sharp bids. These moves can be violent and temporary, so you need to distinguish crisis-driven spikes from the slower, more durable secular trends driven by central bank buying and physical demand.
Statistic callout: Central bank buying momentum has been a persistent structural force in gold markets, creating durable support floors during accumulation phases that retail traders often underestimate.
The challenge side of XAUUSD:
- Volatility cuts both ways. A 30-dollar intraday range sounds great until your stop is too tight and you get shaken out before the move develops.
- News events (Fed decisions, CPI prints, geopolitical headlines) can trigger instant 10–20 dollar moves with no warning. Position sizing and daily loss limits are not optional.
- Session timing matters more here than in most forex pairs. The Asian session is typically thin and choppy; the real directional moves develop in London and accelerate through the New York overlap.
The payoff for getting this right is a market that trends clearly, respects technical levels when the macro context aligns, and offers multiple timeframe opportunities every week.
What actually moves gold: macro, fundamental, and market drivers
Before you draw a single line on the XAUUSD chart, you need a macro read. Chart work executed against the macro bias is one of the most common and expensive mistakes retail traders make. The macro-first framework is straightforward: read the US dollar first, then real yields, then risk sentiment — in that order, every time.
Here is how to apply that framework in practice:
- Check DXY direction. Gold is priced in US dollars, so a stronger dollar mechanically pressures gold and a weaker dollar supports it. This is not a perfect inverse correlation, but it is the first filter. If DXY is trending up on the daily chart, your default bias for XAUUSD is cautious on longs.
- Read real yields. The 10-year Treasury Inflation-Protected Securities (TIPS) yield or the 10-year breakeven inflation rate tells you the opportunity cost of holding gold. When real yields rise, gold faces headwinds because yield-bearing assets become more attractive. When real yields fall or go negative, gold tends to attract flows. Check the CME FedWatch Tool for market-implied Fed rate probabilities, which directly shape where real yields are heading.
- Assess risk sentiment. Equity sell-offs and geopolitical shocks create fast, temporary gold bids. These are tradeable but require tight risk management because the reversal can be equally sharp.
- Factor in structural demand. Central bank buying and physical demand from major markets act as slow-moving but powerful forces. They do not drive intraday moves, but they set the medium-term floor and can make gold sticky above key levels during accumulation phases.
Pro Tip: Use the CME FedWatch Tool before every trading week. If the market is pricing in rate cuts, real yields are likely falling — that is a structural tailwind for gold longs. If rate hike probabilities are rising, tighten your long bias and look for short setups on bounces.
The practical sequence before any XAUUSD entry: DXY trend, real yield direction, risk backdrop, then the chart. Skip step one or two and you are trading blind.
What are the best XAUUSD strategies and when should you use each?
Not every strategy works in every market condition. The table below maps the five core approaches to the conditions where they perform best.
| Strategy | Best Conditions | Timeframe | Key Filter |
|---|---|---|---|
| Trend-following | Clear macro bias, trending DXY/yields | H4–Daily | 200 EMA direction |
| Session breakout | High-volatility opens, news catalysts | M15–H1 | Volume/velocity confirmation |
| Scalping | Tight spreads, active London/NY hours | M1–M5 | Spread below 0.5, clear micro structure |
| Smart Money Concepts (SMC) | Liquidity sweeps visible on HTF | M15–H4 | HTF bias + displacement confirmation |
| Range/mean-reversion | Low ATR, no macro catalyst, choppy | M30–H1 | ATR below 20-period average, RSI extremes |
A top-down liquidity model works across all five: establish H4/H1 bias, mark liquidity pools, wait for the London or New York move, then execute on M15/M5 after confirmation. That framework, detailed in XAUUSD trading strategy research, applies whether you are scalping a micro setup or riding a multi-day swing.
Choosing your strategy:
- Trending macro environment (DXY falling, real yields dropping): trend-following and SMC setups on pullbacks.
- High-volatility session opens with a news catalyst: breakout setups with strict retest rules.
- Choppy, low-ATR Asian session: range/mean-reversion or stand aside entirely.
- Scalping: only viable during London and New York when spreads are tight and order flow is deep.
The biggest mistake is forcing one strategy onto every market condition. Gold shifts frequently between trending and ranging regimes, and the traders who adapt their approach to the current regime consistently outperform those who do not.
How to trade XAUUSD with trend-following: step-by-step swing setup
Trend-following is a reliable framework for gold, but you must separate swing trading from long-term investing. Swing traders capture full move development over days to weeks; they do not react to every intraday candle. The workflow below keeps you on the right side of the trend and gives you a repeatable entry process.
Step-by-step swing trade setup
- Establish daily bias. Check the 200 EMA on the daily chart. Price above the 200 EMA = bullish bias; price below = bearish bias. Only trade in the direction of the 200 EMA until a confirmed break and retest changes the structure.
- Identify daily S/R and FVGs. Mark significant daily support/resistance levels and any Fair Value Gaps (FVGs) left by impulsive moves. These are your Points of Interest (POI) for entries.
- Wait for a pullback. Let price retrace into a POI — a daily S/R level, an FVG, or a confluence of both. Do not chase the initial impulse.
- Drop to H1 or M30 for entry confirmation. Look for a Break of Structure (BOS) or Change of Character (CHOCH) on the lower timeframe that confirms the pullback is ending and the trend is resuming.
- Place your stop. Set the stop below the structural low (for longs) or above the structural high (for shorts) that would invalidate the trade. Alternatively, use 1.5–2x ATR(14) below the entry candle’s low.
- Set targets. First target at the nearest daily high (for longs) or low (for shorts). Scale out 50% there, move stop to breakeven, and let the remainder run to the next significant level.
Worked position-size example:
- Account: $10,000
- Risk per trade: 1% = $100
- Stop distance: 15 pips (in gold terms, $1.50 per 0.01 lot)
- Pip value on a standard lot (100 oz): $1 per pip
- Position size: $100 ÷ 15 pips = 6.67 micro lots (0.067 standard lots)
The 200 EMA + daily S/R + FVG combination is one of the most consistent swing setups in XAUUSD, with ATR-based stops and a minimum 2:1 risk-to-reward target.
Pro Tip: When price is hugging the 200 EMA without a clear rejection, do not enter. Wait for a decisive close above or below, then look for the first pullback. Entries right at the EMA without confirmation are where most fakeouts happen.
Common swing trade filters:
- Macro bias must align (DXY and real yields pointing in the same direction as your trade).
- No major news events within 4 hours of entry (Fed decisions, CPI, NFP).
- ATR(14) on the daily chart above its 20-period average, confirming the market is moving, not stalling.
How to trade price action at support and resistance levels
Price-action trading at S/R is the foundation of most XAUUSD setups, regardless of which strategy overlay you use. The method only works when you mark levels with discipline and follow strict invalidation rules.
Marking high-value S/R levels
Multi-timeframe verification is non-negotiable. A level that appears on the daily chart and is also visible on H4 carries far more weight than a level only visible on M15. Require at least two clear tests of a level before treating it as significant. A single touch is a data point; two or more tests make it a level worth trading.
Look for levels where price previously reversed sharply, left a wick, or consolidated before a major move. Round numbers ($2,000, $2,100, $2,500) also attract institutional attention in gold and are worth noting.
Entry triggers and invalidation
Once price returns to a marked level, you need a trigger before entering. Acceptable triggers include:
- A wick rejection candle closing back inside the level on H1 or H4.
- A BOS on M15 confirming the rejection is holding.
- RSI divergence at the level (price makes a new low but RSI does not).
Invalidation is the hard rule. If price closes a full candle body through your level on the timeframe you marked it on, the level is broken. Exit or do not enter. Do not move your stop to “give it more room.”
Stop placement for S/R trades: Place the stop 5–10 pips beyond the level’s most recent wick extreme, not at the level itself. Gold’s volatility means price often pierces a level briefly before reversing; your stop needs to sit beyond the noise, not inside it.
Common marking mistakes:
- Drawing too many levels and creating a “chart full of lines” that paralyzes decision-making. Limit yourself to three to five active levels per session.
- Using only one timeframe to mark levels. Always verify on at least two.
- Treating a level as permanent. Levels that have been tested many times weaken over time; a level that has been broken and retested flips from support to resistance (or vice versa).
Pro Tip: Mark your levels on the daily chart first, then zoom in to H4 to refine the exact price zone. The daily chart tells you where the big money is watching; the H4 tells you the precise entry zone.
Breakout strategies and session-based setups for XAUUSD
Session timing is where most retail traders leave money on the table. Gold’s biggest directional moves happen during specific windows, and knowing those windows lets you be ready instead of reactive.
Session timing and best hours
| Session | Time (EST) | Characteristics | Best Strategy |
|---|---|---|---|
| Asian session | 7:00 PM – 2:00 AM | Thin liquidity, choppy, range-bound | Mean-reversion or stand aside |
| London open | 3:00 AM – 5:00 AM | High volatility, directional moves begin | Breakout, SMC liquidity sweeps |
| New York open | 8:00 AM – 10:00 AM | Highest liquidity, trend continuation or reversal | Breakout, trend-following |
| London–NY overlap | 8:00 AM – 12:00 PM | Peak volume, tightest spreads | All strategies viable |

The London–New York overlap is the single best window for XAUUSD trading. Spreads are at their tightest, volume is at its peak, and the moves that develop during this window tend to follow through rather than reverse immediately.
Step-by-step breakout entry rules
- Mark the Asian session range. Identify the high and low of the Asian session before London opens. These levels are your breakout triggers.
- Wait for London open (3:00 AM EST). Watch for a decisive break of the Asian range with momentum — a candle that closes clearly beyond the range, not a wick.
- Confirm with velocity. A real breakout moves fast. If price breaks the level and then immediately stalls or reverses, treat it as a false break.
- Retest entry vs. jump-in. For lower risk, wait for price to retest the broken level before entering. For higher probability of catching the move, enter on the first M15 close beyond the range with a tight stop.
- Stop placement. Place the stop inside the Asian range, 5–10 pips from the breakout level. If price returns fully inside the range, the breakout has failed.
- Target. Measure the height of the Asian range and project it from the breakout point. That is your minimum target.
Spread warning: Avoid market orders in the first 2–3 minutes of session opens. Spreads widen sharply at the open and slippage can eat into your edge before the trade even starts.
Scalping XAUUSD: micro setups, execution, and cost management
Scalping gold is viable, but the cost structure is less forgiving than in major forex pairs. You need to be precise about when you scalp, what you pay, and how you manage execution.
Best time windows for scalping XAUUSD:
- London open: 3:00 AM – 5:00 AM EST (high momentum, directional micro moves).
- New York open: 8:00 AM – 10:00 AM EST (news-driven momentum, fast setups).
- Avoid: Asian session (wide spreads, choppy price action, no clear direction).
Micro setup types that work on XAUUSD:
- Momentum continuation: Price breaks a short-term level with a strong candle, pulls back to the broken level on M1–M5, and resumes. Enter on the retest with a stop below the pullback low.
- Wick rejection at a key level: A sharp wick into a known S/R level on M5, followed by a close back above/below. Enter on the next candle open.
- Opening range breakout: Mark the first 5-minute candle of the London or New York session. Trade the break of that candle’s high or low with a stop at the opposite extreme.
Execution checklist for scalping:
- Spread below 0.5 pips (in gold terms). If your broker’s spread is wider, the setup is not viable.
- Use limit orders at FVG entries where possible. Market orders during fast moves carry slippage risk.
- Stop placement: structural, not arbitrary. Even on M1, your stop goes beyond the nearest swing low/high, not at a fixed pip distance.
- Maximum hold time: if the trade has not moved in your direction within 10–15 minutes, reassess. Scalps that stall usually fail.
Cost reality check: On a $10,000 account scalping 0.1 lots, a 0.5-pip spread costs $0.50 per trade. At 10 trades per day, that is $5 in spread costs before slippage. Small numbers, but they compound. Your win rate and average R:R must comfortably cover these costs or scalping erodes your edge.
Pro Tip: Handle FOMO carefully during scalping sessions. The impulse to chase a move that already ran 10 dollars is one of the fastest ways to turn a good scalping session into a losing one. If you missed the entry, mark the next setup and wait.
Smart Money Concepts for XAUUSD: liquidity sweeps, FVGs, and confirmation
SMC is an institutional-style framework that reads gold’s price action through the lens of liquidity and order flow. The SMC workflow for XAUUSD follows a strict top-down sequence that keeps you aligned with the “smart money” moves rather than trading against them.
The SMC workflow: step by step
- Define HTF bias. On H4 and H1, determine whether price is in a bullish or bearish market structure. Look for Higher Highs and Higher Lows (bullish) or Lower Highs and Lower Lows (bearish).
- Identify liquidity targets. Mark equal highs (buy-side liquidity) and equal lows (sell-side liquidity) on H4/H1. These are the pools smart money targets before reversing.
- Wait for a liquidity sweep. Price raids the liquidity pool (a wick beyond equal highs or lows) and then reverses sharply. This sweep is the signal that the move is about to flip.
- Confirm displacement. After the sweep, look for a strong, impulsive candle in the opposite direction that breaks structure. This is displacement — the evidence that institutional orders have entered.
- Identify the FVG or order block POI. The displacement candle often leaves a Fair Value Gap (a three-candle imbalance where the middle candle’s body does not overlap with the wicks of the surrounding candles). This FVG is your entry zone.
- Drop to M15 or M5 for confirmation. Wait for price to return to the FVG and show a BOS or CHOCH on the lower timeframe before entering. Never enter on the first touch of an FVG without confirmation.
- Place stop beyond the sweep extreme. The stop goes beyond the liquidity sweep candle’s wick. If price returns to that level, the setup is invalidated.
FVG entry example: Price on H1 sweeps equal lows at $2,350, then displaces bullishly with a 15-dollar candle, leaving an FVG between $2,352 and $2,358. Price retraces into the FVG on M15. You wait for a BOS on M5 (a higher high forming after the pullback into the FVG). Entry at $2,354, stop at $2,348 (below the sweep wick), target at $2,375 (the next H1 resistance). Risk: $6 per ounce. Reward: $21 per ounce. R:R of 3.5:1.
Range and mean-reversion setups: when gold is not trending
Not every day in XAUUSD is a trending day. Forcing trend-following entries into a ranging market is a reliable way to accumulate losses. The key skill is recognizing when gold is ranging and switching your approach accordingly.
Indicator filters that confirm range conditions:
- ATR(14) below its 20-period average. When ATR is contracting, the market is compressing. Trend-following setups have poor follow-through in this environment.
- RSI oscillating between 40 and 60. When RSI is not reaching overbought or oversold extremes, there is no strong directional momentum.
- Price contained between two clear horizontal levels for three or more sessions. Visual confirmation that the range is established.
Entry checklist for mean-reversion trades:
- Price at the range boundary (support or resistance), not in the middle.
- RSI at or below 30 (for longs at support) or at or above 70 (for shorts at resistance).
- A rejection candle or wick at the boundary before entry.
- Stop placed beyond the range boundary by 5–10 pips.
- Target at the opposite boundary, with a partial exit at the midpoint.
Spotting false ranges and switching strategies:
A false range breaks when price closes a full candle body outside the range boundary with expanding ATR. That is your signal to stop taking mean-reversion entries and switch to a breakout or trend-following approach. Do not fight the breakout by adding to a losing mean-reversion position.
Pro Tip: The Asian session is the most common environment for XAUUSD range conditions. If you are trading during Asian hours and ATR is below average, default to mean-reversion or stand aside. Save your trend-following setups for London and New York.
Multi-timeframe alignment and trade management in XAUUSD
Getting the entry right is only half the job. How you manage the trade after entry determines whether a good setup produces a good outcome.
The multi-timeframe framework
- H4 (HTF bias). This is your directional anchor. The 200 EMA on H4 tells you the dominant trend. Only take trades in the H4 trend direction unless you have a clear structural reversal signal.
- H1 (MTF confirmation). H1 confirms the setup. Look for a POI (FVG, S/R level, order block) on H1 that aligns with the H4 bias. The H1 structure should be showing signs of the pullback ending.
- M15 or M30 (execution timeframe). This is where you enter. Wait for a BOS or CHOCH on M15 that confirms the H1 pullback is complete and the H4 trend is resuming.
This top-down alignment dramatically reduces false entries. A setup that looks good on M15 but contradicts H4 structure is a low-probability trade.
Scaling and trade management
This locks in profit and removes risk from the remaining position.
As price moves in your favor, the trailing stop moves up with it, locking in progressively more profit.
Worked trailing stop example: You enter a long at $2,400 with a stop at $2,385 (15-point risk). ATR(14) is 12. If price reaches $2,430 and the last swing low is $2,418, your trailing stop is at $2,400. The trade is now risk-free and you are participating in further upside.
Statistic callout: Scaling out 50% at 1:1 and trailing the remainder with an ATR-based stop tends to improve average trade outcomes compared to fixed targets, because it captures extended moves when they develop while protecting capital when they do not.
Indicators and correlation filters that sharpen XAUUSD signals
Indicators are filters, not signals. The moment you treat an indicator as a standalone entry trigger, you are one step away from overtrading. Use these tools to confirm what the macro and structure are already telling you.
Core indicators for XAUUSD:
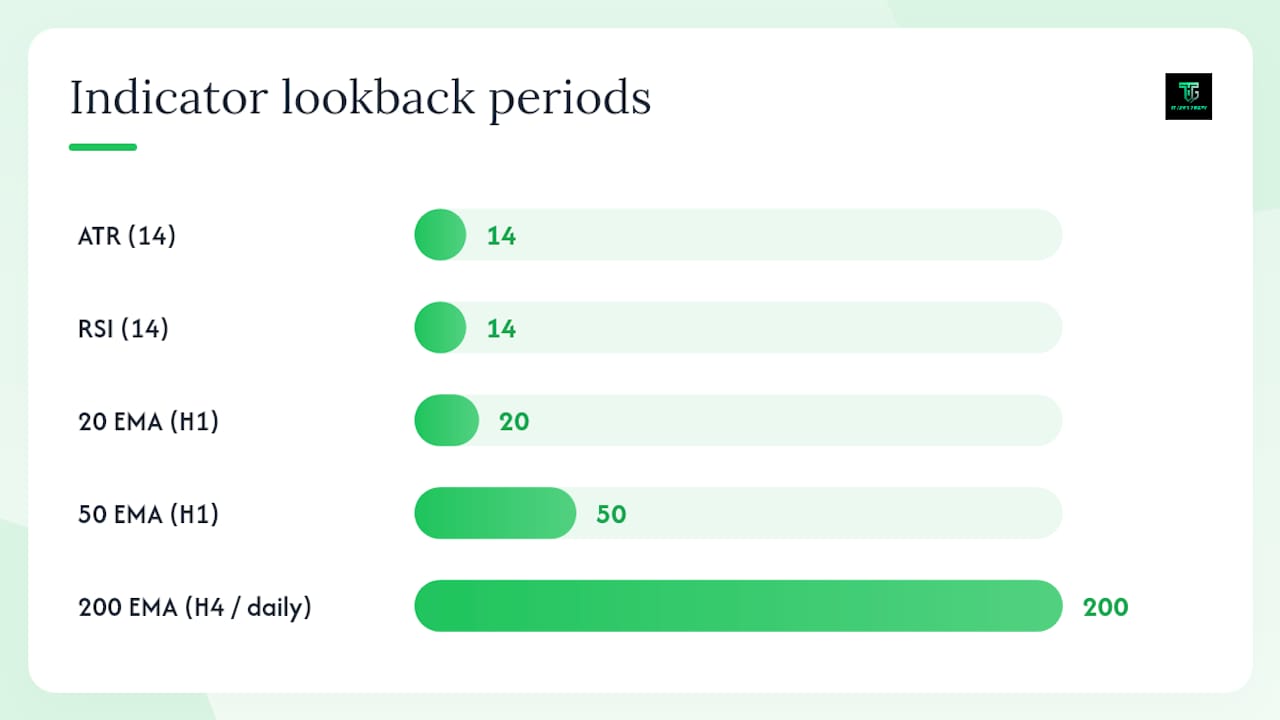
- ATR(14). The primary tool for stop sizing. Never place a stop tighter than 1x ATR on your execution timeframe. ATR also tells you whether the market is in a trending or ranging phase.
- 200 EMA (daily and H4). The directional filter. Trade in the direction of the 200 EMA; treat entries against it as lower probability until a confirmed structural break occurs.
- RSI(14). Use for exhaustion signals, not as a standalone entry trigger. RSI above 70 at a known resistance level adds weight to a short setup; RSI below 30 at support adds weight to a long.
- Moving average cross (20/50 EMA on H1). A secondary confirmation tool for trend continuation. A bullish cross on H1 during a pullback in an H4 uptrend adds confluence to a long entry.
Correlation checks:
- DXY. Check the daily DXY chart before every session. A DXY trending up is a headwind for gold longs; a DXY trending down is a tailwind. The correlation is not perfect, but it is the most consistent macro filter available.
- Real yields (10-year TIPS or 10-year breakeven). Rising real yields pressure gold; falling real yields support it. Use the CME FedWatch Tool to track where the market expects yields to go.
- Equity risk sentiment. A sharp equity sell-off often creates a temporary gold bid. These moves are fast and can reverse equally fast; do not chase them without a structural setup.
When correlations mislead: During extreme risk-off events (a financial crisis, a geopolitical shock), gold can rally even when the dollar is also rallying. In those environments, the DXY correlation breaks down temporarily. Recognize the regime and adjust your filters accordingly.
Pro Tip: Never use more than three indicators on your chart at the same time. More indicators create more conflicting signals, not more clarity. ATR for stops, 200 EMA for direction, and RSI for exhaustion is a complete toolkit for most XAUUSD setups.
Risk management and position sizing for XAUUSD: formulas and worked examples
Gold’s intraday range and occasional spike behavior make risk management non-negotiable. The position-sizing rules that work in slower forex pairs need to be applied with even more discipline in XAUUSD.
Position-size calculation formula
Formula: Position Size (lots) = (Account Equity × Risk %) ÷ (Stop Distance in pips × Pip Value per lot)
For XAUUSD, pip value on a standard lot (100 oz) is $1 per pip (where 1 pip = $0.10 per ounce). On a mini lot (10 oz), pip value is $0.10 per pip.
Worked examples
ATR-based stop example: ATR(14) on H1 is 8 pips.
Hard risk rules
- Maximum 1–2% risk per trade. No exceptions, regardless of how confident you feel about a setup.
- Daily loss limit: 3–4% of account equity. If you hit this limit, stop trading for the day. The psychology of revenge trading after a losing streak is one of the fastest ways to blow an account.
- Maximum two to three open positions simultaneously. Correlated positions in the same direction multiply your effective risk.
- Volatility-adjusted sizing. When ATR expands significantly (major news events), reduce position size by 30–50% to account for wider stops and unpredictable price behavior.
- Never use fixed pip stops. Structural invalidation determines your stop, not a round number. A 10-pip stop on a market with a 25-pip ATR is a guaranteed stop-out.
Trader Gibkey validated setups and live trade examples
The difference between a strategy that looks good in theory and one that works in live markets is the journal. Every setup below follows the same structure used in Tradergibkey’s live trading sessions: entry, stop, target, R:R, and outcome.
Live trade example structure
Setup: SMC long on XAUUSD (H1/M15)
- Session: London open, 3:30 AM EST
- Macro bias: DXY trending down on daily; real yields falling; bullish H4 structure
- Setup type: Liquidity sweep of equal lows on H1, displacement candle, FVG entry on M15
- Entry: $2,388 (limit order at FVG midpoint)
- Stop: $2,381 (below sweep wick)
- Target 1: $2,402 (1:1 R:R, 50% close)
- Target 2: $2,415 (daily resistance, remainder)
- R:R: 1:2 on full position
- Outcome: Target 1 hit, stop moved to breakeven, Target 2 hit on New York session continuation
This is the exact format Tradergibkey uses to review trades in live sessions. Every field matters because every field is a decision point you can improve.
Journaling template fields
- Date and session (London/New York/Asian)
- Macro bias at entry (DXY direction, real yield direction, risk sentiment)
- Setup type (SMC, trend-following, breakout, S/R, scalp)
- Entry price, stop price, target price(s)
- Position size and account risk %
- R:R ratio
- Outcome (win/loss/breakeven) and notes on execution quality
Backtest and forward-test checklist:
- Run the setup on at least 50 historical examples before trading it live.
- Track win rate, average R:R, and maximum drawdown across the sample.
- Forward-test on a demo account for at least four weeks before committing real capital.
- Review your journal weekly. Look for patterns in your losing trades — time of day, session, macro context, or execution errors.
Pro Tip: The root causes of trading system failure are almost never the strategy itself. They are inconsistent execution, skipped journaling, and abandoning a system after a short losing streak. Journal every trade, every time.
Pre-trade execution checklist and the best times to trade XAUUSD
A checklist is not bureaucracy. It is the difference between a disciplined trade and an impulse trade. Run through this before every entry.
Pre-trade checklist
- Macro check. DXY direction confirmed. Real yield direction confirmed. Risk sentiment noted.
- HTF bias. H4 market structure identified. 200 EMA direction noted. Trade direction aligns with H4 bias.
- POI drawn. Entry zone marked on the chart (FVG, S/R level, order block). Level verified on at least two timeframes.
- Invalidation defined. Stop level identified before entry. Structural invalidation point is clear.
- Position size calculated. Risk % applied. Stop distance measured. Lot size calculated using the formula.
- Spread check. Current spread is within acceptable range (below 0.5 pips for scalping, below 1.0 for swing entries).
- Daily loss guard. Check current day’s P&L. If within 1% of daily loss limit, reduce size or stand aside.
Best hours to trade XAUUSD
- London open (3:00 AM – 5:00 AM EST): Best for breakout and SMC setups. Directional moves begin here.
- London–New York overlap (8:00 AM – 12:00 PM EST): Peak volume and tightest spreads. All strategies viable.
- New York session (8:00 AM – 5:00 PM EST): Strong for trend continuation and news-driven setups.
No-trade conditions
- Major news events within 30 minutes (Fed decisions, CPI, NFP, geopolitical headlines).
- Asian session with no clear range boundary and ATR below average.
- Spread above 1.5 pips (broker liquidity is poor; fills will be bad).
- Daily loss limit reached.
- No clear HTF bias (price is mid-range between major levels with no directional structure).
- You are overtrading — more than three to four setups already taken in the session.
The no-trade list is as important as the entry checklist. Knowing when to stand aside is a skill, not a weakness.
What I have learned from 18 years of trading XAUUSD
Gold is the most honest market I trade. It rewards preparation and punishes impatience in equal measure. The traders who struggle with XAUUSD are almost always the ones who skip the macro read and go straight to the chart — they are trading a picture, not a market.
The single biggest shift in my own trading came when I stopped treating every setup as equally valid and started filtering aggressively by macro context. A technically perfect SMC setup against a rising DXY and rising real yields is a low-probability trade, full stop. The chart is the last input, not the first.
Discipline and journaling are not separate from strategy. They are the strategy. Every trader I have worked with who made consistent progress kept a detailed journal and reviewed it weekly. Every trader who plateaued skipped the journal. That pattern holds without exception across 18 years of live market experience.
Tradergibkey can help you put these setups into practice
Most traders who read a guide like this one know what to do. The gap is in the execution: staying consistent under pressure, sizing correctly when volatility spikes, and not abandoning a system after three losing trades.

Tradergibkey’s structured courses and live mentorship sessions are built around exactly that gap. You get step-by-step lessons on XAUUSD price action and SMC setups, live trade reviews where you see entries, stops, and targets in real time, journaling templates and trading system frameworks, daily market analysis with macro bias updates, and a community of traders working through the same setups you are.
The mentorship is not about handing you signals. It is about building the decision-making process that makes you consistent across any market condition. If you are ready to move from reading about XAUUSD strategies to executing them with real discipline, start with Tradergibkey’s mentorship program and see what structured, experience-backed training actually looks like.
Sources
Further reading and tools used in this guide:
- How to Trade Gold XAU/USD: Dollar, Yields & Macro Framework
- All Gold trading strategies you need to know
- Central bank gold statistics: buying momentum continues — November
- CME FedWatch Tool
This article is general information, not a substitute for advice from a qualified financial advisor. Consult a qualified financial professional about your own circumstances before acting on anything here.
FAQ
What is the best timeframe to trade XAUUSD? The H4–Daily combination for swing bias and M15–H1 for execution gives the best balance of signal quality and trade frequency for most active traders.
How much should I risk per trade on XAUUSD?
When is the best time of day to trade XAUUSD? The London–New York overlap (8:00 AM – 12:00 PM EST) offers peak liquidity, tightest spreads, and the most reliable directional moves.